Bitcoin ETF Outflows Explained: What They Mean for Price
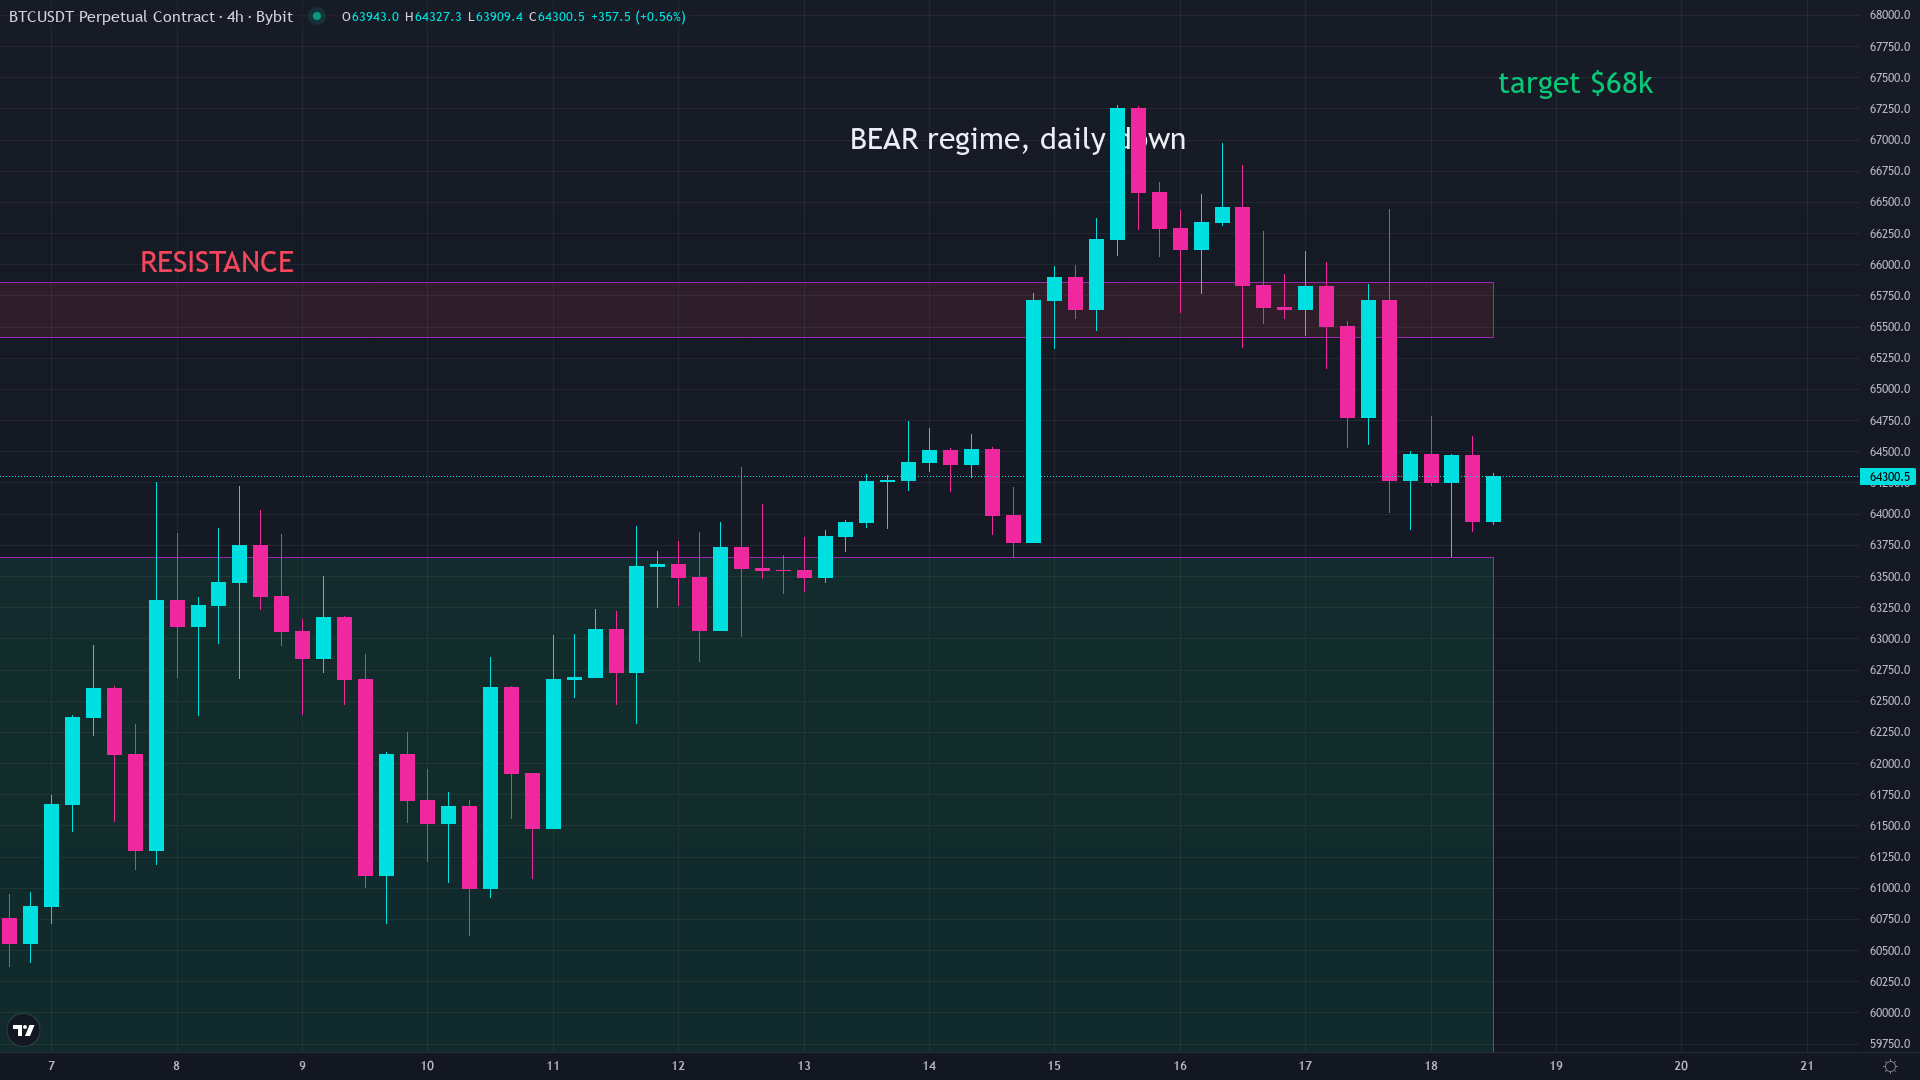
Bitcoin ETF outflows hit record territory in June 2026. Over $3.4 billion left U.S. spot Bitcoin funds in a single week, the largest streak since the products launched in January 2024. The Fear and Greed Index sits at 15, Extreme Fear. Bitcoin is trading around $64,325, roughly 16.6% below its 200-day moving average.
If you read the headlines, this looks like capitulation. If you read the flow data, it looks like something more specific and more useful.
What Bitcoin ETF outflows actually are
An ETF outflow happens when investors redeem shares faster than new investors buy them. The fund sells the underlying Bitcoin to meet those redemptions, and the daily flow number goes negative. U.S. spot Bitcoin ETFs collectively hold over 1.29 million BTC, making them one of the largest holder groups on the planet. When billions move in or out of that pool, the order book feels it.
But the mechanics matter more than the headline number. ETF redemptions flow through authorized participants (large broker-dealers) who sell BTC in the open market or offset internally. A $82 million outflow day does not mean $82 million hit the spot market as a single sell order. Some of that flow nets against creation orders from other funds, and some gets absorbed by market makers running neutral books. The pace of outflows matters more than any single session.
Why Bitcoin ETFs bled $3.4 billion in one week
The June streak was not random panic. It had a trigger: the Federal Reserve.
The FOMC held rates at 3.50% to 3.75% on June 17. That alone was expected. What was not expected: the updated dot plot showed 9 of 18 committee members penciling in at least one more rate hike before December, and only 1 member projected a cut. The PCE inflation forecast jumped to 3.6%, up from 2.7% just three months earlier. Chair Kevin Warsh, in his first meeting, declined to submit a personal dot, which markets read as deliberate ambiguity.
That is a hawkish shock. And Bitcoin ETFs are disproportionately held by systematic allocators (hedge funds, multi-asset managers, RIA models) who reduce risk-asset exposure when the risk-free rate stays elevated. They are not selling because they hate Bitcoin. They are selling because a 3.75% guaranteed yield competes with a volatile asset in a daily downtrend.
The outflow sequence: 13 consecutive sessions of net negative flow, totaling over $4.3 billion. Then a brief $85.85 million inflow on June 12, led by BlackRock’s IBIT at $57.7 million. Bulls declared the turn. One session later, $82.16 million walked back out, ARKB leading the exit at $43.53 million. That is not a reversal. That is a dead cat bounce inside an institutional unwind driven by rate expectations.
Do ETF outflows crash the Bitcoin price?
Sometimes. Not always. And the distinction matters.
Outflows add selling pressure to one side of a scale. Whether that tips the price depends on what is happening on the other side. In March 2025, ETFs bled over $2 billion in a month while Bitcoin held a range, because spot demand from other buyers absorbed the flow. In June 2026, the selling hit a market already weakened by a daily downtrend, extreme fear sentiment, and thin bid-side liquidity. The context made the outflows hurt more than the dollar amount alone would suggest.
Here is the pattern worth watching: sustained outflows (5+ sessions) during a downtrend with falling funding rates and rising implied volatility tend to precede further downside. A single negative session after a string of inflows is noise. The streak, the trend, and the funding environment together tell the story. Right now, funding sits at the 18th percentile, implied volatility (DVOL) at 38.7, and the daily trend is down. That combination is not a buy signal.
When ETF outflows stop mattering
Every outflow streak in the short history of spot Bitcoin ETFs has ended. The question is never if the bleeding stops, but what stops it.
Two things have historically flipped the flow: a shift in rate expectations (the Fed pivoting dovish or inflation rolling over) and price reaching a level where the risk/reward math changes for systematic allocators. Neither has happened yet. The dot plot just got more hawkish, and BTC is still above its June low of $59,052.
The market does not care about your thesis. It prices the spread between the risk-free rate and expected crypto returns. When that spread compresses, through lower rates, through a deep enough Bitcoin drawdown, or through a genuine catalyst like new ETF approvals, the flows reverse. Until then, the outflow data is telling you exactly what the institutional bid is doing: stepping aside.
One more thing. Liquidation events that flush leveraged longs during outflow streaks tend to mark the exhaustion point. The $1.57 billion in long liquidations earlier this month is worth tracking for that reason, not because it means the bottom is in, but because it shows how much forced selling has already occurred.
The takeaway
- ETF outflows are not a panic button. They are a data stream showing what institutional allocators are doing with real money.
- The June 2026 outflow streak was rate-driven, not sentiment-driven. The FOMC dot plot did the damage.
- Single-session reversals after a long streak mean nothing. Watch for a sustained flip in flow direction alongside a change in rate expectations.
- Context decides impact: outflows in a downtrend with low funding and high vol hurt more than outflows in a range.
Common questions
What does it mean when Bitcoin ETFs have outflows?
It means investors are redeeming their ETF shares faster than new buyers are entering. The fund sells Bitcoin to meet those redemptions, adding selling pressure to the market.
Do Bitcoin ETF outflows cause the price to drop?
Outflows add selling pressure, but whether the price drops depends on the broader context. Sustained outflows during a downtrend with thin liquidity hurt more than a single negative session in a range.
How much Bitcoin do US spot ETFs hold?
U.S. spot Bitcoin ETFs collectively hold over 1.29 million BTC, making them one of the largest holder groups globally.
Why did Bitcoin ETFs lose $3.4 billion in June 2026?
The FOMC dot plot showed 9 of 18 members expecting at least one more rate hike in 2026, with only 1 projecting a cut. Systematic allocators reduced crypto exposure because elevated risk-free yields compete directly with volatile assets.
When do Bitcoin ETF outflows usually stop?
Historically, outflow streaks reverse when rate expectations shift dovish or when Bitcoin reaches a price level where the risk/reward math changes for institutional allocators. Neither a single positive session nor a headline reversal is sufficient.
Keep reading
- Bitcoin Funding Rate Explained: The Signal Most Traders Miss
- Crypto Liquidation Explained: What 272,000 Traders Missed
We break down the market like this every day, free on Instagram and YouTube, and in depth inside the community.
Education, not financial advice. Trading involves real risk.