Bitcoin July Seasonality: Does July Bounce?
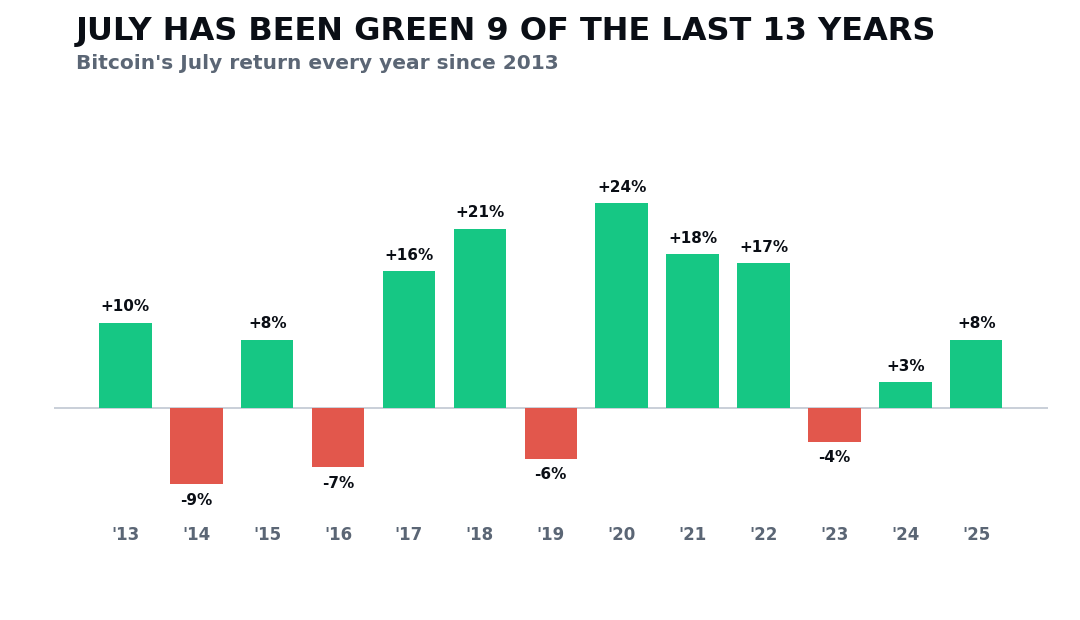
It is day 265 of this bear market. Bitcoin is down about 52% from its all-time high, and down roughly 18% in June alone, sitting near $60,000. If you are holding through this and feeling stupid for it, here is one fact worth knowing before you do anything. The month that has rescued Bitcoin more often than any other is about to start. This is what Bitcoin July seasonality actually says, with real numbers and zero hype.
Seasonality just means the calendar pattern. The simple question is whether a particular month tends to go up or down across many years of history. For Bitcoin, July has quietly been one of the kindest months on the calendar. Let me show you the receipts, and then the part most people skip.
Does Bitcoin go up in July? The 13-year record
Here is the plain answer. Going back to 2013, July has finished higher in 9 of the last 13 years. That is about 7 in every 10 years. The average July gain across all 13 years is close to 8%.
Put that next to a coin toss. A random month would land green about half the time. July lands green about 7 times in 10, and when it goes up, it tends to go up by a meaningful amount. That is what makes July stand out. It is not a guarantee, but over 13 years it has clearly leaned in one direction more than the others.
One note on the math so nobody can accuse us of cooking it. You will sometimes see a bigger number floating around, something like a 10% average over 14 years. That older figure quietly includes July 2012, back when Bitcoin was a tiny coin worth a few dollars and a single good month could swing 40%. We left 2012 out on purpose. A 40% move on a coin nobody owned is not a fair comparison to today. Keep the count and the average on the same honest 13-year window, and you get green 9 of 13 and an average near 8%.
The bitcoin july pump in bear-bottom years
Now the part that matters most when you are down this bad. Bitcoin has carved out a real bear-market bottom three separate times in its history, in 2015, 2018, and 2022. In every one of those three years, July closed green. No exceptions.
The numbers were not small either. July gained about 8% in 2015, about 21% in 2018, and about 17% in 2022. That averages out to roughly a 16% green month in the exact years that hurt holders the most. So when people talk about a “bitcoin july pump” in a bear market, this is the history they are pointing at. Three brutal bottoms, three green Julys.
And here is why that rhymes with right now. Today Bitcoin is about half off its high, deep in a bear, with fresh new lows printed in June. That is the same kind of hole 2015, 2018, and 2022 were sitting in. We are walking into July looking a lot like all three of them.
The honest caveat the pump crowd skips
This is the part I will not let you walk away without. A clean record is exciting, and excitement is exactly when people get hurt.
First, three years is a tiny sample. Three for three sounds airtight, but a streak that short can still be luck. It tilts the odds in your favor. It is not a law of nature. A green July this year is likely. It is not promised.
Second, and this is the big one. A bounce is not the same as the bottom. Price can pop green for a whole month while the bigger trend is still pointed down, then roll over and fall to a new low below where we sit today. A green July inside a bear market can be a relief rally, the kind of move that suckers people into thinking the worst is over right before the worst arrives. If you want the longer view on that, read how long do bitcoin bear markets last, because the floor in past cycles has taken time to actually form.
Third, this edge is near-term. The seasonal lean is strongest over the next month or two and fades by about three months out. It is a reason to watch closely, not a reason to bet everything on a single month.
So two things can be true at the same time. July leans green, especially in years that look like this one. And the final low for this cycle may still be ahead of us. That tension is the whole picture. Anyone handing you only the bullish half is doing you a disservice.
Why July, and what to actually do with it
Nobody can hand you a tidy reason July behaves this way, and you should be suspicious of anyone who pretends to. Some of it is likely just where July tends to land inside Bitcoin’s longer four-year rhythm. If you want the bigger map that July sits inside, the bitcoin four year cycle explained piece lays out the full pattern of tops, crashes, and bottoms.
The practical takeaway is simple. Use seasonality as a tilt, not a trigger. It is one more honest input that says the odds of a green month here are better than a coin flip, and noticeably better in years that look like this one. It does not tell you the bottom is in. It does not tell you to go all in. It just nudges the odds, and knowing the real odds is most of the battle.
I pulled July’s full year-by-year record, the bear-bottom history, and exactly where the trap is into one free guide called The July Playbook. You can grab it at bitcoin-daily.com/guides/july-playbook.pdf, or comment JULY2026 on our Instagram and we will send it to you. And if you want the data walked through every single day alongside other people holding through this, that is what the community is for.
Common questions
Does Bitcoin go up in July?
More often than not. Since 2013, July has closed green in 9 of the last 13 years, about 7 in every 10, with an average gain close to 8%. That is a clear lean, but it is a tendency, not a guarantee.
What is Bitcoin July seasonality?
Seasonality is the calendar pattern, meaning whether a given month tends to go up or down across many years. For Bitcoin, July has historically leaned green more than most months, finishing higher in 9 of the last 13 years.
Is there really a Bitcoin July pump?
In bear-bottom years, history says yes. In the three years Bitcoin carved a real bear-market bottom, 2015, 2018, and 2022, July closed green every time, up about 8%, 21%, and 17%. But three years is a tiny sample and a green July is a lean, not a promise.
Does a green July mean the bottom is in?
No. A bounce is not the same as the bottom. A green July can be a relief rally inside a bigger downtrend that then rolls over to a new low. The seasonal edge is near-term and fades by about three months out.
Why does Bitcoin tend to rise in July?
There is no single clean reason, and you should be wary of anyone who claims one. Part of it is likely just where July tends to fall inside Bitcoin's longer four-year rhythm. Treat seasonality as a tilt in the odds, not a trigger to act on.
Keep reading
We break down the market like this every day, free on Instagram and YouTube, and in depth inside the community.
Education, not financial advice. Trading involves real risk.