Bitcoin vs the Money Supply
The bitcoin money printer theory is the most repeated idea in crypto: the Fed prints, Bitcoin follows, there is no timing required. It feels airtight because it fits the most famous window perfectly. Fifteen years of full-record data tell a different story, and right now that story is playing out in real time with nowhere to hide.
Why the Theory Feels True
The belief traces almost entirely to the 2020-2021 window. The Federal Reserve dramatically expanded its balance sheet to backstop the economy after the pandemic shock. Bitcoin surged at the same time. Two rising lines on the same chart, at the same moment, look like proof.
But every financial asset rose in that window. Gold rose. Stocks rose. Real estate rose. Correlating anything to a period of universal monetary expansion is not finding a signal, it is finding noise. A theory that only fits one favorable stretch and ignores the rest of the record is not a theory, it is a coincidence dressed as a law. The honest test is the full fifteen years, including every stretch where the story does not hold.
Test 1: The Size Mismatch
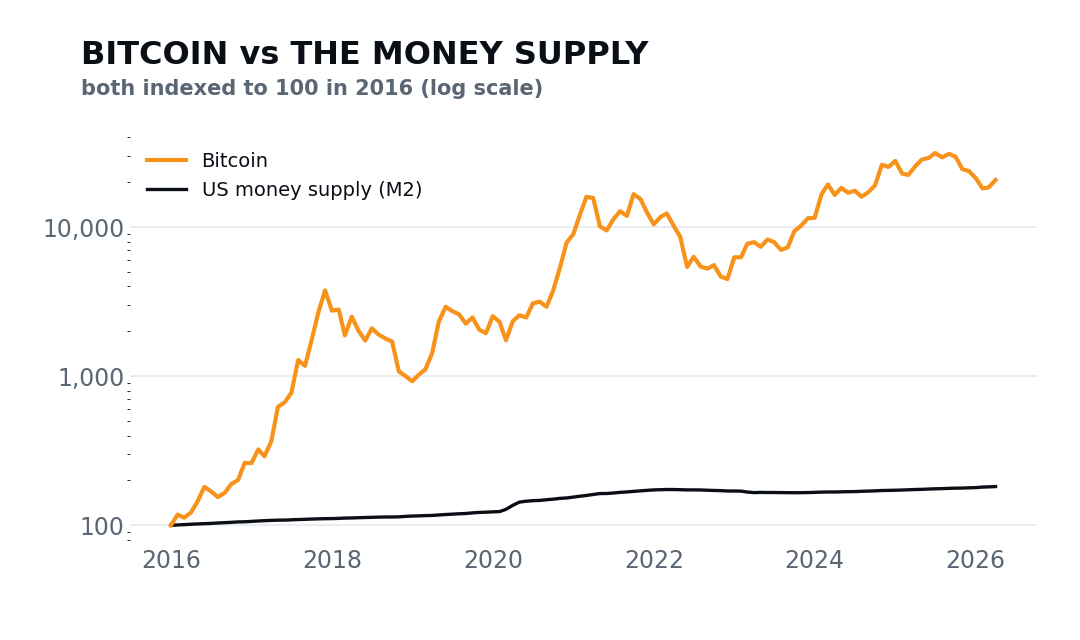
Start with scale. Over the past decade, the US money supply (M2, the broadest measure of dollars in circulation, including bank deposits and money market accounts) grew roughly 77%. In the same decade, Bitcoin grew roughly 11,467%. That is approximately 149 times the magnitude.
If printing were the engine, the fuel and the explosion would need to be comparable. They are not even in the same order of magnitude. Liquidity expands by single-digit percentages each year, grinding steadily upward on a chart that looks almost like a straight line. Bitcoin has moved 149 times faster over the same horizon. A force that produces a 77% lift cannot be the primary cause of an 11,467% move. It can be part of the backdrop. It cannot be the engine.
Test 2: The Correlation Is Essentially Zero
Correlation is measured on a scale from negative one to positive one. A score of positive one means two variables move in perfect lockstep. A score of zero means knowing one tells you nothing about the other. A score of negative one means they move in opposite directions perfectly.
The correlation between Bitcoin's yearly return and M2's yearly growth rate, measured across the full available record, is 0.04. Squaring that number gives the share of Bitcoin's annual variance actually explained by M2 growth: 0.0016, or roughly 0.16%. The remaining 99.8% of what Bitcoin does each year comes from something else entirely. A model that tried to time Bitcoin using only M2 as its input would be nearly indistinguishable from a coin flip.
This does not mean liquidity is irrelevant over long horizons. Money supply expansion is a real slow tailwind for most hard assets. Inflation mechanically erodes the purchasing power of cash, which lifts nominally priced assets over time and over years. But a tailwind and a trigger are not the same instrument. A tailwind is directional and slow: it explains why an asset is higher in decade two than decade one. A trigger is event-driven: it causes a specific move at a specific time. The 0.04 says M2 has almost no trigger power for Bitcoin at all.
The Live Stress Test
The cleanest proof of any theory is a real-time one. Right now the bitcoin money printer narrative is failing that test in the open.
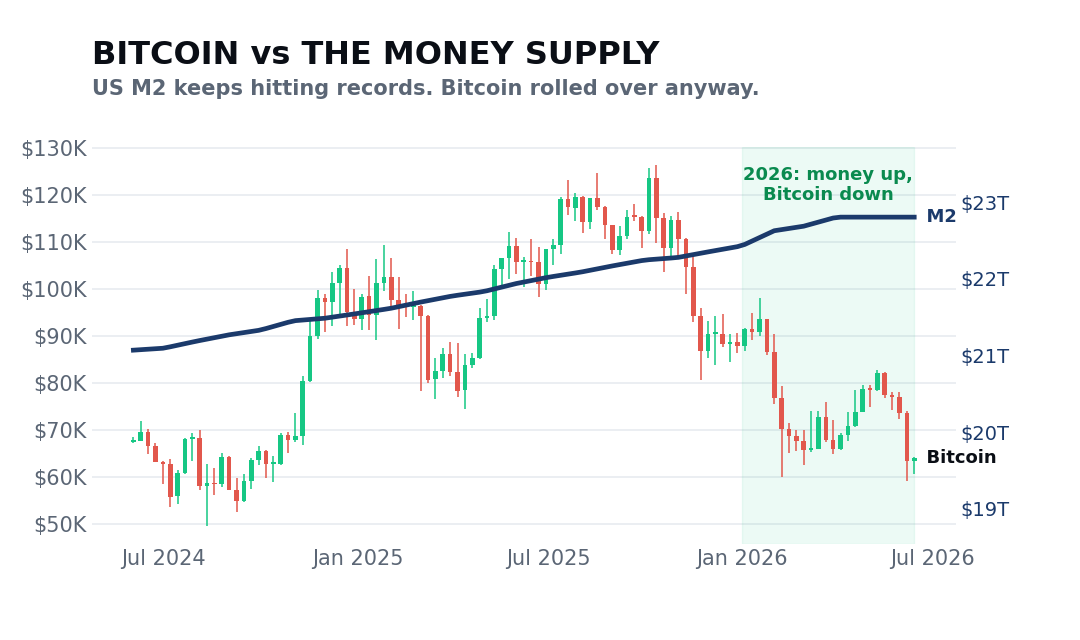
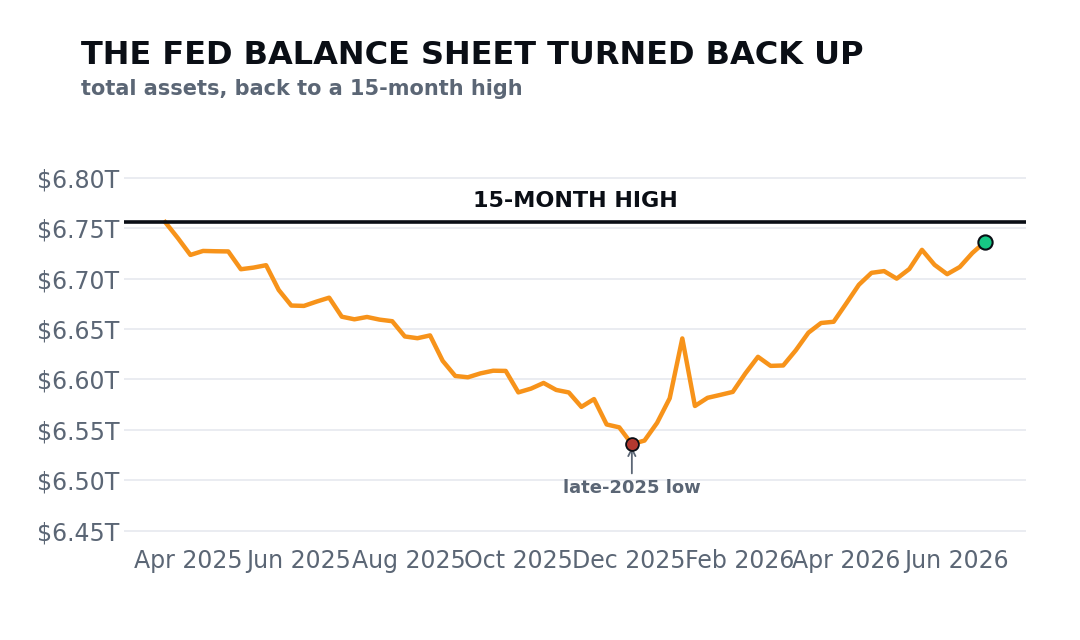
The US money supply stands at roughly $22.8 trillion, a new all-time high. The Federal Reserve's balance sheet, after more than two years of quantitative tightening (the process of shrinking the balance sheet by letting bonds mature without reinvesting the proceeds), has turned back upward. It now sits at roughly $6.7 trillion, its highest level in approximately 15 months, up about 3% from its late-2025 low. By the printer theory's own logic, Bitcoin should be near or at a high. Instead, Bitcoin is roughly 49% below its October 2025 all-time high of approximately $126,272.
Liquidity rising. Bitcoin falling. At the same time, on the same chart. One piece of honest context: the Fed's balance sheet, while turning back up, remains roughly 25% below its 2022 peak of $9.0 trillion. Liquidity is becoming incrementally more supportive, not explosively expansive. But the conclusion holds regardless of degree. M2 at an all-time high did not hold Bitcoin up. The trigger claim does not survive the live test.
What Actually Runs the Clock
If not the printer, what explains Bitcoin's four-year rhythm? The answer is inside Bitcoin's own code. Roughly every four years, the Bitcoin protocol cuts the block reward in half in an event called the halving. Miners, who provide the computing power that secures the network, receive newly minted Bitcoin as compensation. The halving cuts that compensation in half, which directly reduces the rate at which new coins enter circulation. When demand stays flat or grows and new supply suddenly drops, the supply-demand balance shifts. This is a scheduled, protocol-enforced event that operates completely independently of what the Federal Reserve decides in any given meeting.
The key distinction is that the halving is endogenous: it is written into Bitcoin's rules and fires on a block-height schedule regardless of macro conditions. M2 growth is exogenous: it reflects policy decisions made by committees of humans responding to inflation, unemployment, and political pressure. Using an exogenous macro variable to explain a cycle driven by an endogenous supply mechanism is using the wrong instrument. It is like trying to predict a train's arrival time by watching the weather instead of the timetable.
Where Bitcoin Sits Right Now
The 200-day moving average is the simple average of Bitcoin's closing price over the past 200 trading days. It smooths short-term noise and marks where price has been spending its time over roughly nine to ten months of trading, which is why it functions as a standard regime indicator across institutions and risk models.
Bitcoin is currently trading roughly 18% below its 200-day moving average. That places it in the bear regime by this measure. The money supply at a record high did not prevent that. The Fed's balance sheet turning back upward did not prevent that. The liquidity backdrop is incrementally less hostile than it was at the peak of quantitative tightening, and over a long enough horizon that matters as a background condition. But right now, the background condition is not overriding Bitcoin's own internal dynamics.
What You Do With This
The practical error the printer theory produces is not just being wrong directionally. It is reaching for the single input with almost no predictive power and treating it as the main one, while the inputs that actually move Bitcoin sit ignored. The trader who buys because the Fed printed is acting on the weakest variable on the board. The stronger ones are Bitcoin's own supply schedule and its four-year halving rhythm, the mechanics written into the protocol. That is where the timing lives.
So weight liquidity correctly: one input among several, not the primary clock. The clock that actually times Bitcoin's cycle is written into the protocol itself. That is what fifteen years of data says, and it is what the live divergence confirms right now.
I break down the market like this every day, free, on Instagram. To trade alongside me and the community, come to bitcoindaily.vip.
Educational, not financial advice. Every cycle is different and past performance is not a guarantee.
We break down the market like this every day, free on Instagram and YouTube, and in depth inside the community.
Education, not financial advice. Trading involves real risk.