The Bitcoin Bottom Checklist, September 2026: 14 Signals, Scored in Public
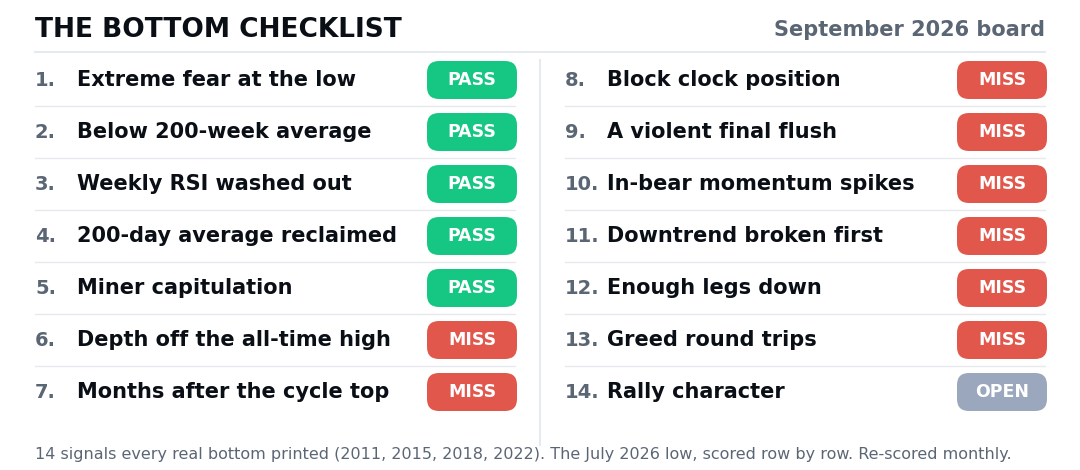
Every real Bitcoin bottom printed the same 14 signals. Not opinions, measurable ones, tested against every bottom we can actually score. This is the September 2026 edition of the board, and from now on it gets re-scored on the 1st of every month, in public, whichever way it moves.
How the checklist is built
Each row was tested against all four measurable bottoms, November 2011, January 2015, December 2018 and November 2022. A signal that failed even once was thrown out, and the rejections were published too. Volume capitulation is the famous example. It looks like a classic bottom signal and it appeared at exactly 1 of 4 bottoms, so it is not on the list. The block-clock rows compare 3 of 3 because 2011 predates the first halving. Prices are Bitstamp, extremes are quoted on intraday wicks, and the board is scored the same way in both directions. Rows are never added when they flatter the bear case or deleted when they stop.
What August changed
Three rows moved during August. One flipped green. Price reclaimed its 200-day average on August 19, the first time in 289 days, and every real recovery eventually fired from above that line. Two flipped red. A momentum spike fired on August 21, the 9th of this bear, and the previous 8 all rolled over to new lows. Then greed hit 74 on the Fear and Greed index on August 25, the 3rd greed episode of this bear, and greed readings inside bear markets are 6 for 6 at preceding new lows. One green, two reds, and the reds weigh more because they are the rows about what the market has completed, not how the crowd feels.
The 5 signals the July low passed
Start with the bull case, because it is real. On July 1 Bitcoin printed $57,735 and the panic gauges reached the depths they reached at the real bottoms. The Fear and Greed index printed 11, the 2018 bottom printed 11 and the 2022 bottom printed 21. Price closed 13% below the 200-week average, and every prior bottom formed below that line. Weekly RSI hit 33, against bottom readings of 28 to 34. Miners capitulated, with hash rate down 22% over three months and the hash ribbon inverted for 33 of 45 days. And the aftermath started correctly, with the 200-day average reclaimed in August. Five for five on the fear cluster. Whatever else is true, the July low felt like the real ones, and hash rate has since recovered about 19%, which is also what real bottoms look like afterward.
The reds about depth and time
Now the other side of the board. Real bottoms fell 77 to 93% from the cycle top. The July low was 54% below the October 2025 high of $126,272. Real bottoms arrived 12.0 to 13.4 months after the top, and we are at month 10.9. Mature bears took 5 to 6 legs down before the final low. This one has taken 2. None of these rows are about fear. They are about how much of the job the bear had finished when the low printed. The crowd's capitulation arrived in July. By these measures, the market's has not.
The sharpest miss, the flush that never came
Every real bottom ended with violence. At least one day of -13.7% or worse, inside a three-day crash of 21.5% or worse, four times out of four. July's worst single day was -6.4%, half the mildest flush ever recorded at a bottom, on below-average volume. The slide into $57,735 was a grind of 3% to 6% days, never a crash. Since July 1 the worst single day has been -3%. And to pre-empt the obvious reply, this bear's one genuinely violent day, February 5 at -13.1%, came five months before the low and was still undercut afterward. At every real bottom the violence and the low arrived together, within days. In 2026 they have never met.
The reds about behavior
The most reliable pattern on the board has nothing to do with sentiment. Every real recovery broke its downtrend first, then got hot. In early 2023 price snapped the bear's sequence of lower highs before greed and hot momentum returned. This bear's line is $82,833, the last lower high, set on May 6. There have been zero daily closes above it. The highest close even reached was $82,193. Meanwhile the hot readings arrived anyway. In-bear momentum spikes have rolled over to new lows 8 of 8 times, and greed inside bears is 6 for 6 at preceding new lows. Heat inside an unbroken downtrend has one record, as a trap. Heat after the break has been ignition. The order is the tell, and the break has not happened.
The pending row is answering itself
The one row that could not be scored in August was rally character. Real exits from real bottoms ran +81% to +306% over 3 to 6 months. This rally topped at +41% on day 58, at $81,455 on August 28. Since then the lower timeframes have printed a double top under the May high, a lower low at $76,877, and a second lower low at $76,380 on September 1. Greed has cooled from 74 to 63. As of this writing it is day 63 and price is 5% off the top. The row stays open until the rally either resolves into a real exit or fails, but the gauges are rolling over in the same order as every trap before it.
The two clocks
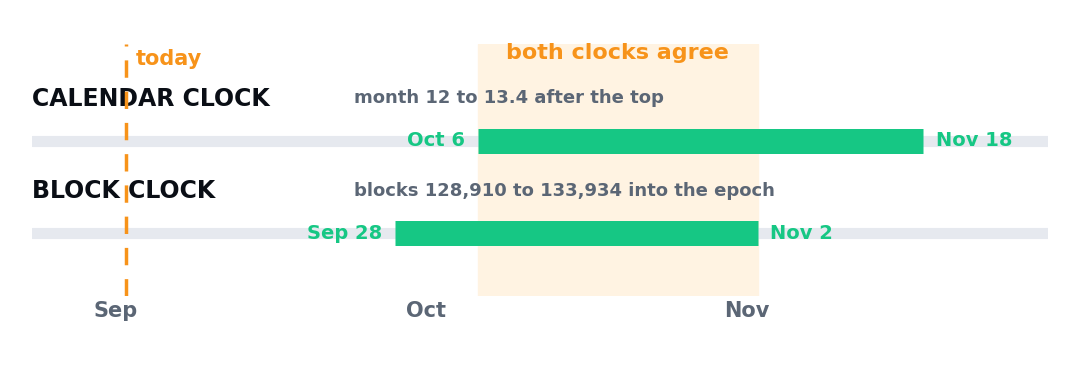
The calendar clock first. The last three bears set their final low 13.4, 12.0 and 12.4 months after their cycle top. The October 2025 top is 10.9 months behind us, so the calendar window opens at month 12, early October, and runs to mid November. Now the protocol's own clock. Measured in blocks into the halving epoch, the three bottoms of the halving era landed between 128,910 and 133,934 blocks in. The chain sits at 125,181 blocks into this epoch. The band opens in about 3,700 blocks, roughly 26 days, which is late September, and runs to early November. Two clocks built from completely different materials agree on the same six weeks. That agreement is not proof. It is the reason the timing rows are scored red today, and the reason they can flip green within weeks. By both clocks, July 1 was early.
The September board
5 green. 8 red. 1 pending. The same count as the August debut, with both clocks five weeks closer. Two prices settle it, not opinions. Above $82,833 on a daily and weekly close, the downtrend structure that has defined this bear is finished and everything gets re-evaluated in public. Below $57,735, the July low, the clock rows were right and the real window was still ahead exactly as they said. The honest limits belong here too. Four bottoms is four bottoms, three for the halving-clock rows, and a checklist built on them is a base rate, not a law. The board is re-scored on October 1, whichever way it moves.
The full checklist, every row tested against the real bottoms, the July low scored line by line, the missing flush and both clocks, is free in The Bottom Checklist.
Education, not financial advice.
Common questions
Is the Bitcoin bottom in as of September 2026?
By the 14-signal checklist, not yet. The July 2026 low at $57,735 passed the 5 sentiment and stretch signals (extreme fear, below the 200-week average, weekly RSI washout, miner capitulation, and a later 200-day reclaim) but missed the 8 signals about depth, time, structure and completion, including the violent final flush and a broken downtrend. The board reads 5 green, 8 red, 1 pending, and is re-scored on the 1st of every month.
What signals does every Bitcoin bottom print?
Fourteen measurable ones, each tested against the 2011, 2015, 2018 and 2022 bottoms: extreme fear, a close below the 200-week average, a weekly RSI washout, miner capitulation, a later 200-day reclaim, a drawdown of 77 to 93% from the top, 12 to 13.4 months after the top, a block-clock position of 128,910 to 133,934 blocks into the halving epoch, a violent final flush day of -13.7% or worse, in-bear momentum spikes resolving, the downtrend breaking before the heat returns, 5 to 6 legs down, greed round trips resolving, and a rally that runs +81% or more over 3 to 6 months.
When does the Bitcoin bottom window open in 2026?
Two independent clocks point at the same six weeks. The calendar clock, based on the last three bears bottoming 12.0 to 13.4 months after their top, opens the window in early October 2026 and runs to mid November. The block clock, based on the three halving-era bottoms landing 128,910 to 133,934 blocks into the epoch, opens in late September 2026 and runs to early November.
What changed on the Bitcoin bottom checklist in August 2026?
Three rows moved. Price reclaimed its 200-day average on August 19 for the first time in 289 days, which flipped that row green. A momentum spike fired on August 21, the 9th of this bear, and greed reached 74 on August 25, the 3rd greed episode of this bear. Both flipped red because inside bear markets those readings have preceded new lows 8 of 8 and 6 of 6 times.
What would prove the bearish reading wrong?
A daily and weekly close above $82,833, the last lower high of this bear. That would end the downtrend structure and trigger a public re-evaluation of every row. A break below $57,735 would confirm the clock rows instead. Either outcome is published the same way.
Keep reading
- What If the Bitcoin Bottom Is Already In? The Strongest Bull Case, Tested.
- I Was Wrong About August. Here Is the Full Scoreboard, and My September Call.
- August Closes Tonight as the First Green Bear-Market August in Bitcoin's History.
We break down the market like this every day, free on Instagram and YouTube, and in depth inside the community.
Education, not financial advice. Trading involves real risk.