Bitcoin Fear and Greed Index Explained
The Bitcoin Fear and Greed Index is sitting at 23 right now. That is deep in the Extreme Fear zone, a reading that shows up in headlines every time the market gets ugly. Most of those headlines say one of two things: either the sky is falling, or it is time to buy. Both are lazy. Here is what this number actually means, what it measures, and whether it has any real track record of predicting what comes next.
What the Bitcoin Fear and Greed Index actually measures
The index takes a handful of market signals and crunches them into a single score from 0 to 100. Zero means maximum fear. One hundred means maximum greed. Anything below 25 is labeled Extreme Fear. Anything above 75 is Extreme Greed.
Five inputs drive the score:
- Price swings. When the price is whipping around more than usual, the index reads that as fear. Calm, steady moves read as confidence.
- Momentum. Is the price pushing higher with strong volume, or fading on thin volume? Strength scores greedy, weakness scores fearful.
- Social media. The index crawls posts and hashtags looking for panic language versus hype language.
- Google searches. A spike in searches like “is Bitcoin dead” pushes the score toward fear. A spike in “how to buy Bitcoin” pushes it toward greed.
- Bitcoin dominance. When money hides in Bitcoin instead of flowing into smaller coins, the index reads that as fear. When money spreads out into altcoins, it reads that as greed.
Each input gets a weight, and the final number updates once a day. Different providers (Alternative.me, CoinMarketCap, Binance) run their own versions with slightly different weights, so the exact score can vary by 10 to 20 points on the same day. The direction usually agrees, even when the number does not.
What Extreme Fear readings got right
The index has been running since 2018, and it has hit Extreme Fear during every major crash. The track record in those moments is surprisingly consistent: buying during deep fear and holding for 90 days has never produced a negative return in the index’s history. The average 90-day gain after a reading below 10 is roughly 48%.
Some real examples:
- March 2020 (COVID crash). The index spent about 50 days in the Extreme Fear zone. Bitcoin was near $5,000. Within 12 months it hit a new all-time high above $60,000.
- June 2022 (Terra/Luna collapse). The index dropped into single digits. Bitcoin was around $18,000. It took longer, but by late 2023 the price had doubled.
- February 2025. The index hit an all-time low of 5. Bitcoin was under pressure from macro headwinds and regulatory noise. It recovered significantly over the following months.
On the surface, the message looks simple: when everyone is terrified, buy. But that framing hides the part that actually matters.
What Extreme Fear readings got wrong
The index can stay in Extreme Fear for months. In 2022, it sat below 25 for over 70 consecutive days, the longest streak in its history. If you bought the first day it hit Extreme Fear in June 2022 at around $22,000, you watched it drop another 30% to $15,500 before the real bottom showed up five months later.
That is the problem with using this number as a buy signal: it tells you people are scared, but it does not tell you when the fear ends. It can be correct about the general direction (eventually, these readings have always led to higher prices) while being completely wrong about the timing.
A reading of 23 today does not mean the price cannot go lower. It means sentiment is deeply negative. Those two things are not the same.
How to actually use the index
Think of it like a thermometer, not a traffic light. It measures the temperature of the room. It does not tell you what to do about it.
What it is good for:
- Spotting the crowd. When the index is at 23, the average person in the market is making decisions from fear. That is useful context. It does not mean they are wrong. It means you know the bias.
- Checking yourself. If the index reads Extreme Fear and you also feel panicked, you are trading the same emotion as everyone else. That is worth knowing before you hit the sell button.
- Big-picture framing. Over multi-month periods, extended Extreme Fear readings have lined up with the best entry points in Bitcoin’s history. But “multi-month” and “entry point” are doing a lot of heavy lifting in that sentence. The recovery can take a year or more.
What it is not good for:
- Timing entries. Buying the first Extreme Fear reading has historically meant sitting through more pain before the actual bottom.
- Predicting short-term price. The index tells you mood, not direction. A score of 10 can go to 5 before it goes to 50.
The honest take on today’s reading
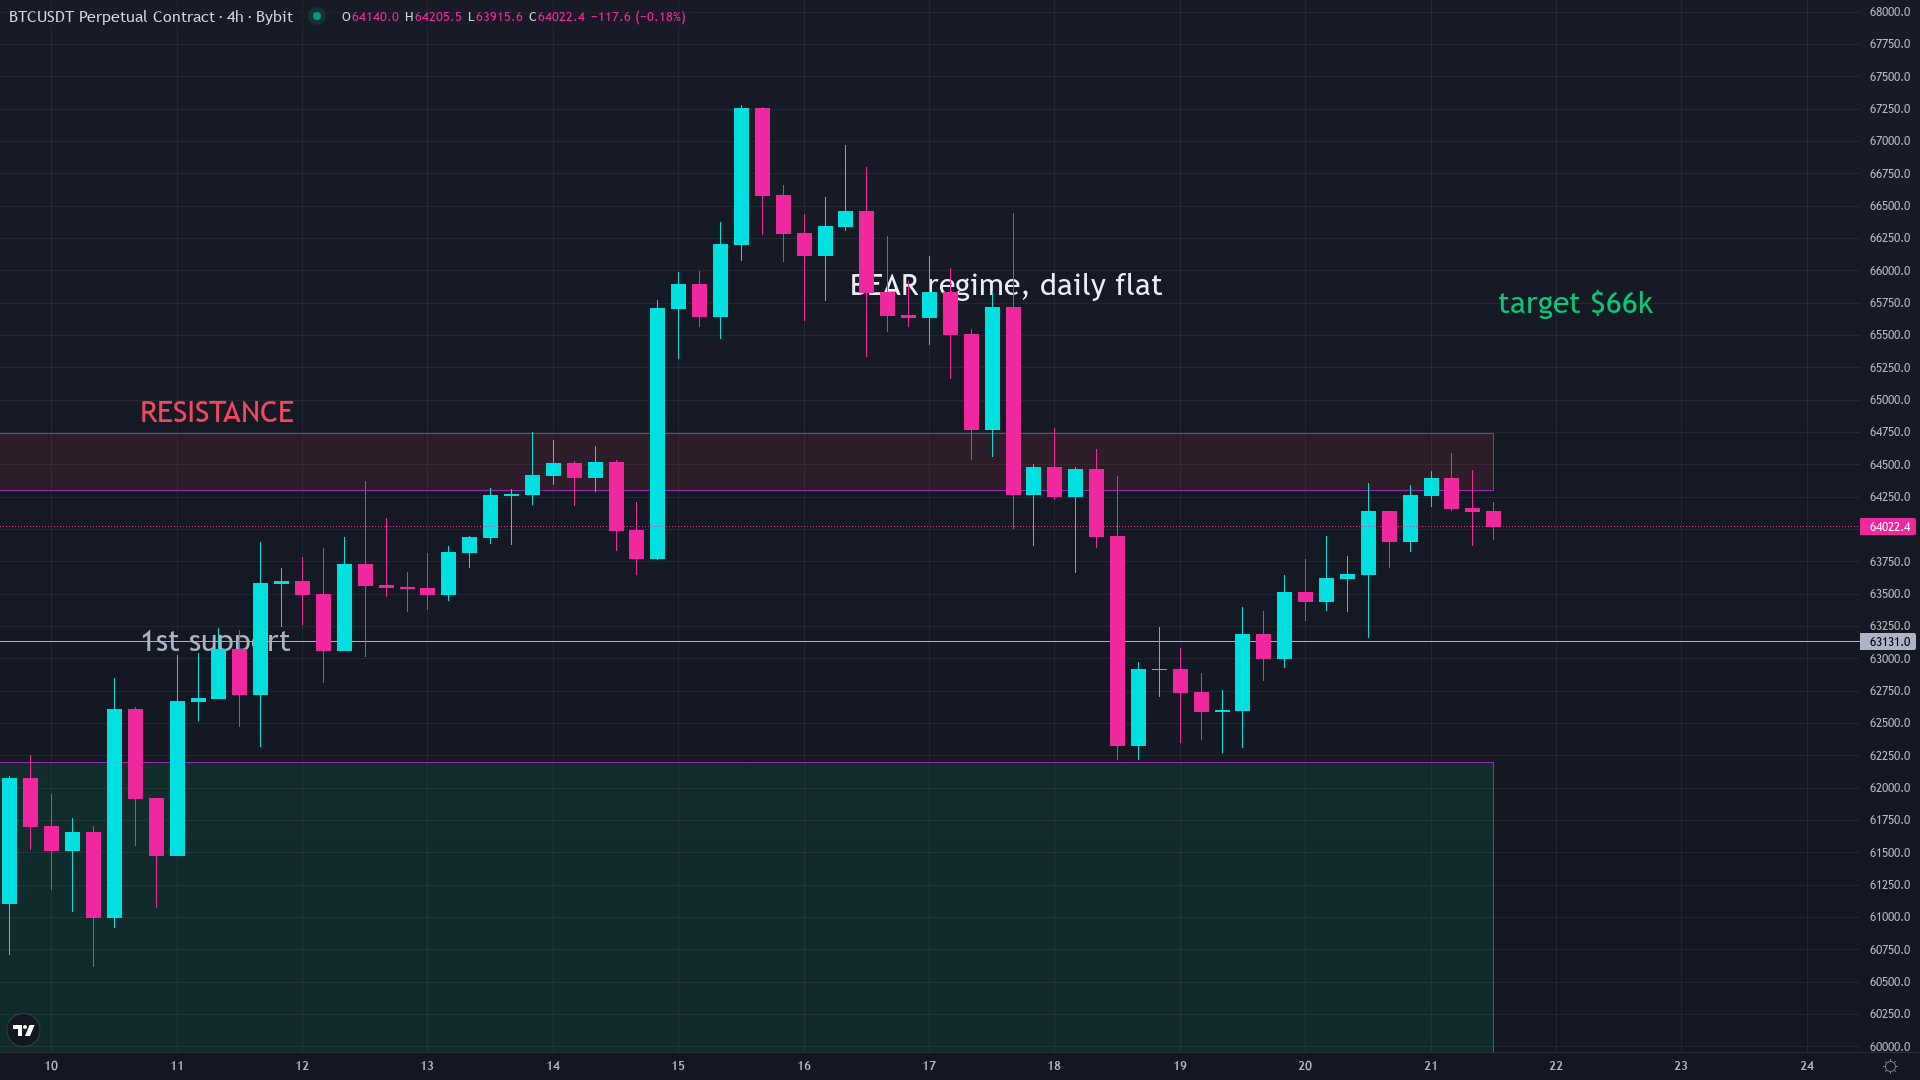
Bitcoin is at $64,073 as of June 21, 2026. The Fear and Greed Index is at 23. The price is sitting about 16% below its 200-day average, which is deep in bear territory by any measure. All three timeframes (daily, 4-hour, 1-hour) are flat, meaning the market is not trending in either direction right now.
Is the market scared? Yes. Does that mean it is time to buy? The index cannot answer that. What it can tell you is that periods like this one, where fear is elevated and the price is well below its long-term average, have historically been followed by strong returns eventually. The word eventually is doing all the work. In 2022, “eventually” meant five more months of pain.
Use the index as one piece of context, not a trading signal. Know what it measures, know what it misses, and make your own decision with both eyes open.
Common questions
What is the Bitcoin Fear and Greed Index?
A daily score from 0 to 100 that measures market sentiment. It combines price swings, trading volume, social media activity, Google search trends, and Bitcoin dominance into one number. Below 25 is Extreme Fear, above 75 is Extreme Greed.
Is extreme fear a buy signal for Bitcoin?
Not by itself. Historically, buying during Extreme Fear and holding for 90 days has never produced a loss. But the index can stay in Extreme Fear for months, meaning you may sit through significant further drops before the recovery begins.
How accurate is the Fear and Greed Index?
It is a reliable thermometer for crowd sentiment, not a price predictor. It tells you how scared or greedy the market is right now, but it cannot tell you when the mood will shift or how much further the price can move in either direction.
What does a Fear and Greed Index of 23 mean?
A score of 23 falls in the Extreme Fear zone (below 25). It means the market is dominated by fear: prices are swinging sharply, search interest is negative, and traders are pulling back from risk.
How often is the Bitcoin Fear and Greed Index updated?
The index updates once per day. Different providers like Alternative.me, CoinMarketCap, and Binance each publish their own version, so the exact number can vary by 10 to 20 points on the same day depending on their weighting.
Keep reading
- Will Bitcoin Recover? Every Crash Since 2011, and How Long It Took to Come Back
- How Long Do Bitcoin Bear Markets Last?
We break down the market like this every day, free on Instagram and YouTube, and in depth inside the community.
Education, not financial advice. Trading involves real risk.
See it live on the charts