The Bitcoin Gold Signal Everyone Is Reading Wrong
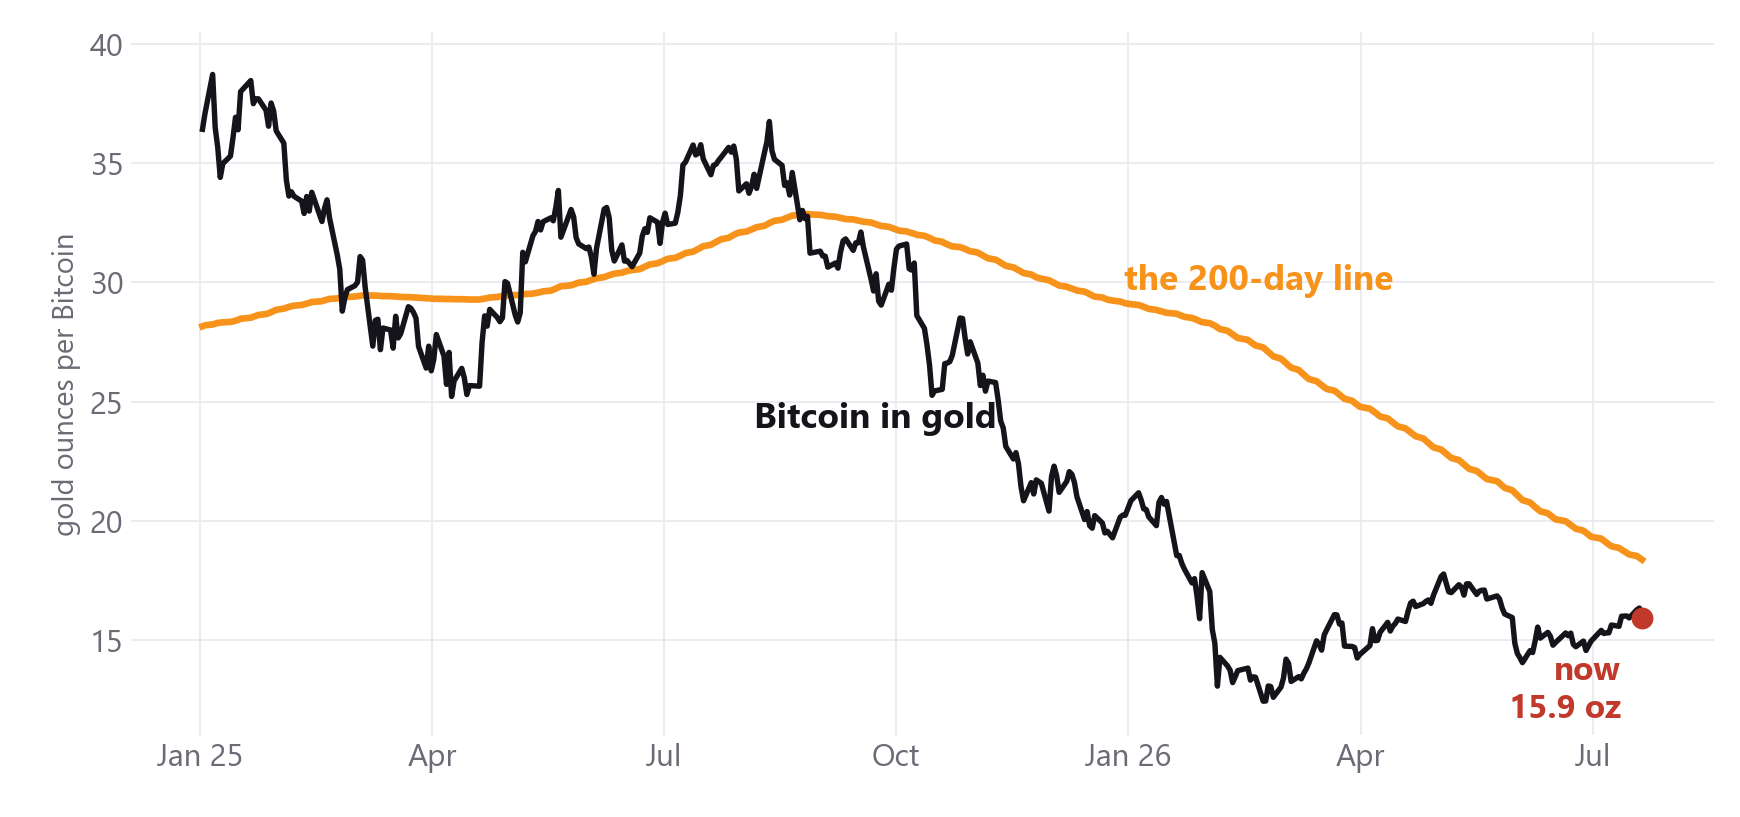
Every influencer on your feed is posting the same chart this week. Bitcoin priced in gold, crossing back above its 200-day trend line. The pitch is always the same. This signal has called the end of every Bitcoin bear market, four for four since 2012, and it just flashed for the fifth time in history.
The record they quote is real. We checked. But we also checked the 38 times the same line crossed and nobody made a highlight reel, and we measured what was actually pushing the line each time. That second check changes the whole story, because the cross forming right now is being produced by something none of the four real winners ever relied on. Gold falling apart.
What the signal actually measures
Divide Bitcoin's price by the price of gold and you get one number. How many ounces of gold one Bitcoin is worth. Right now that is 15.9 ounces, with Bitcoin near $66,101 and gold near $4,147.
Track that number against its own 200-day average, the market's long-run trend line, and you have the signal. When Bitcoin in gold terms crosses back above the line after a long stretch below, the claim goes, the bear market is over.
The four real wins, honestly stated
Four times, the reclaim really did mark the end of a bear. May 2012, July 2015, April 2019 and February 2023. The bottom never broke after any of them.
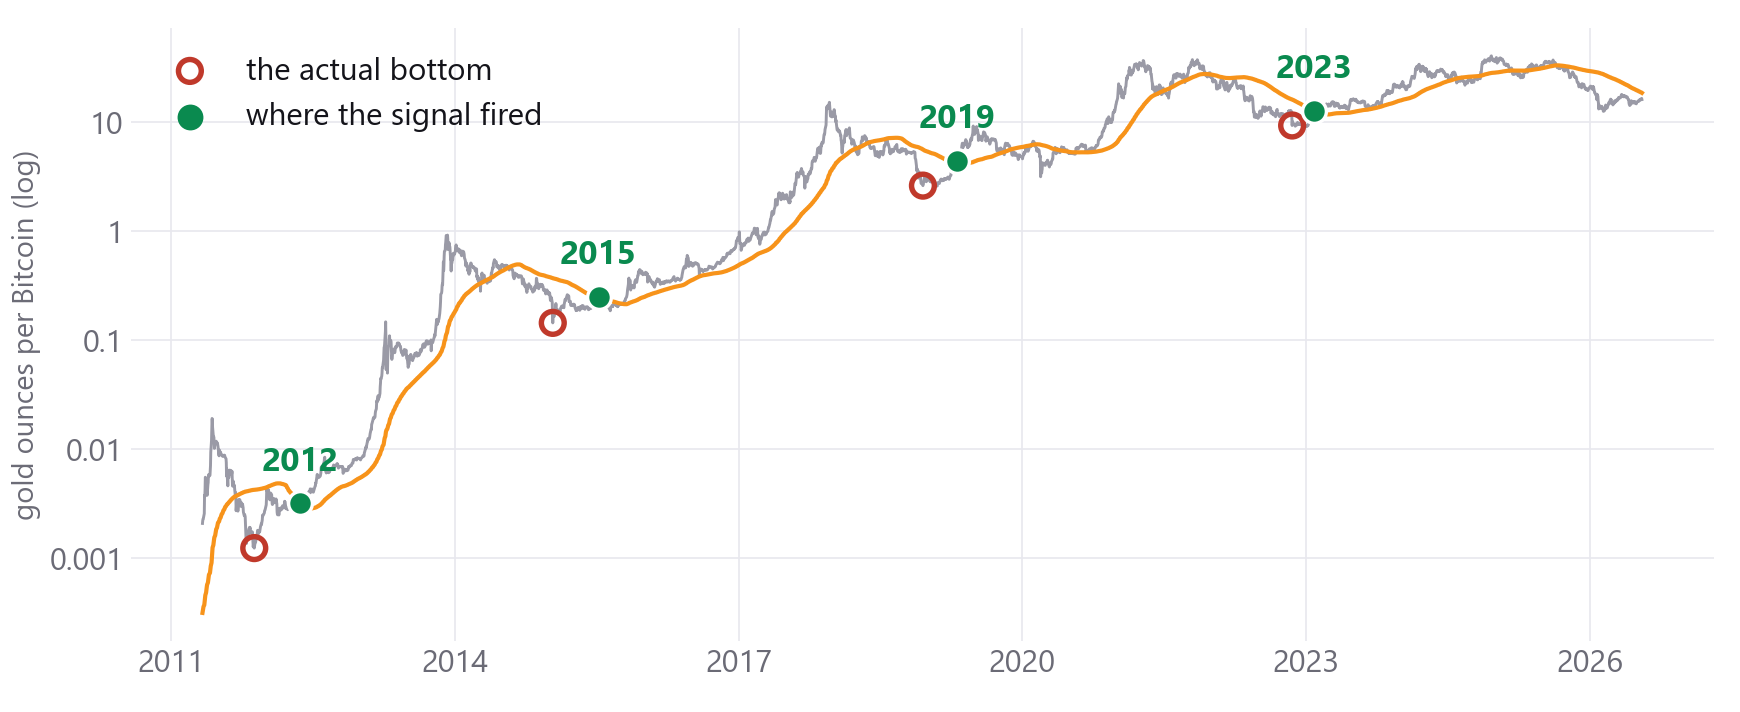
Look at where the green dots sit compared to the red rings. Every real signal fired months after the actual low, at prices 48% to 135% above it. The 2019 signal came 129 days after the bottom, 71% higher. The 2023 signal came 86 days after, 48% higher. This indicator has never been early once. It confirms turns that already happened. It does not predict them.
The 38 crosses nobody posts about
Zoom out to all the data and the undefeated record dissolves. Since 2011 the line has crossed up 42 times, not four. The median cross fell back below within six days.
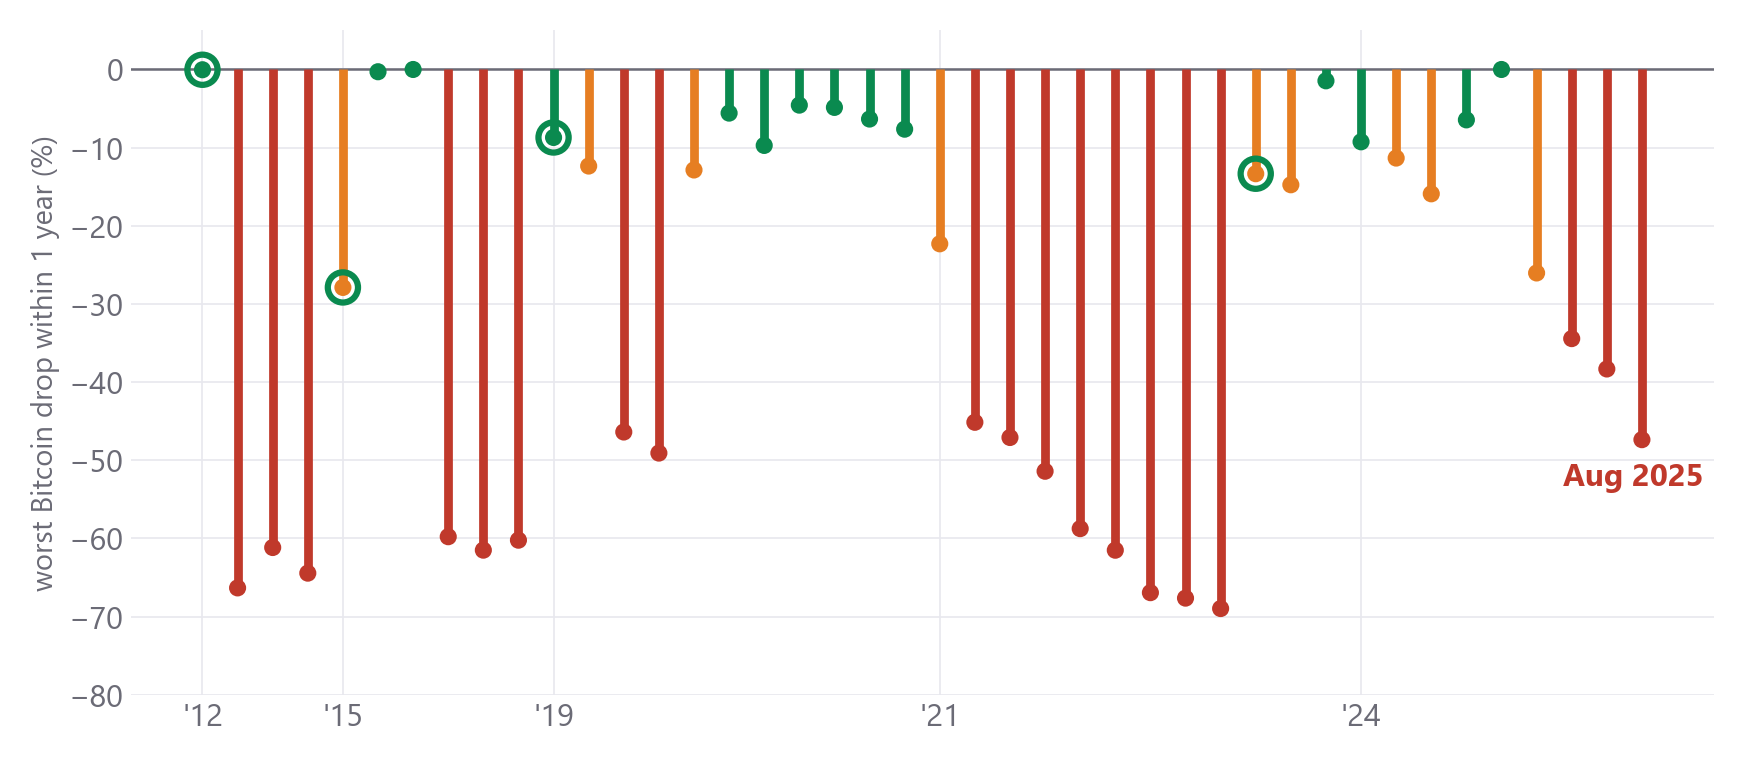
17 of the 42 were followed by another 45% drop or worse within a year. The three 2014 crosses preceded eight more months of bear market. The April 2018 cross preceded a 60% collapse. The December 2021 crosses lost 65% in a year. The most recent one fired in August 2025 at $111,895, and six months later Bitcoin was 42% lower.
What separated the four real ones from the 38 fakes was timing. Every real signal fired a year or more after the cycle top, at or past the actual bottom. Most fakes fired just months into the decline, while the crowd was still hoping the top was a dip.
Who was actually moving the line
Here is the part almost nobody checks. A ratio rises for two opposite reasons. Bitcoin getting stronger, or gold getting weaker. The chart cannot tell you which one happened. The data can.
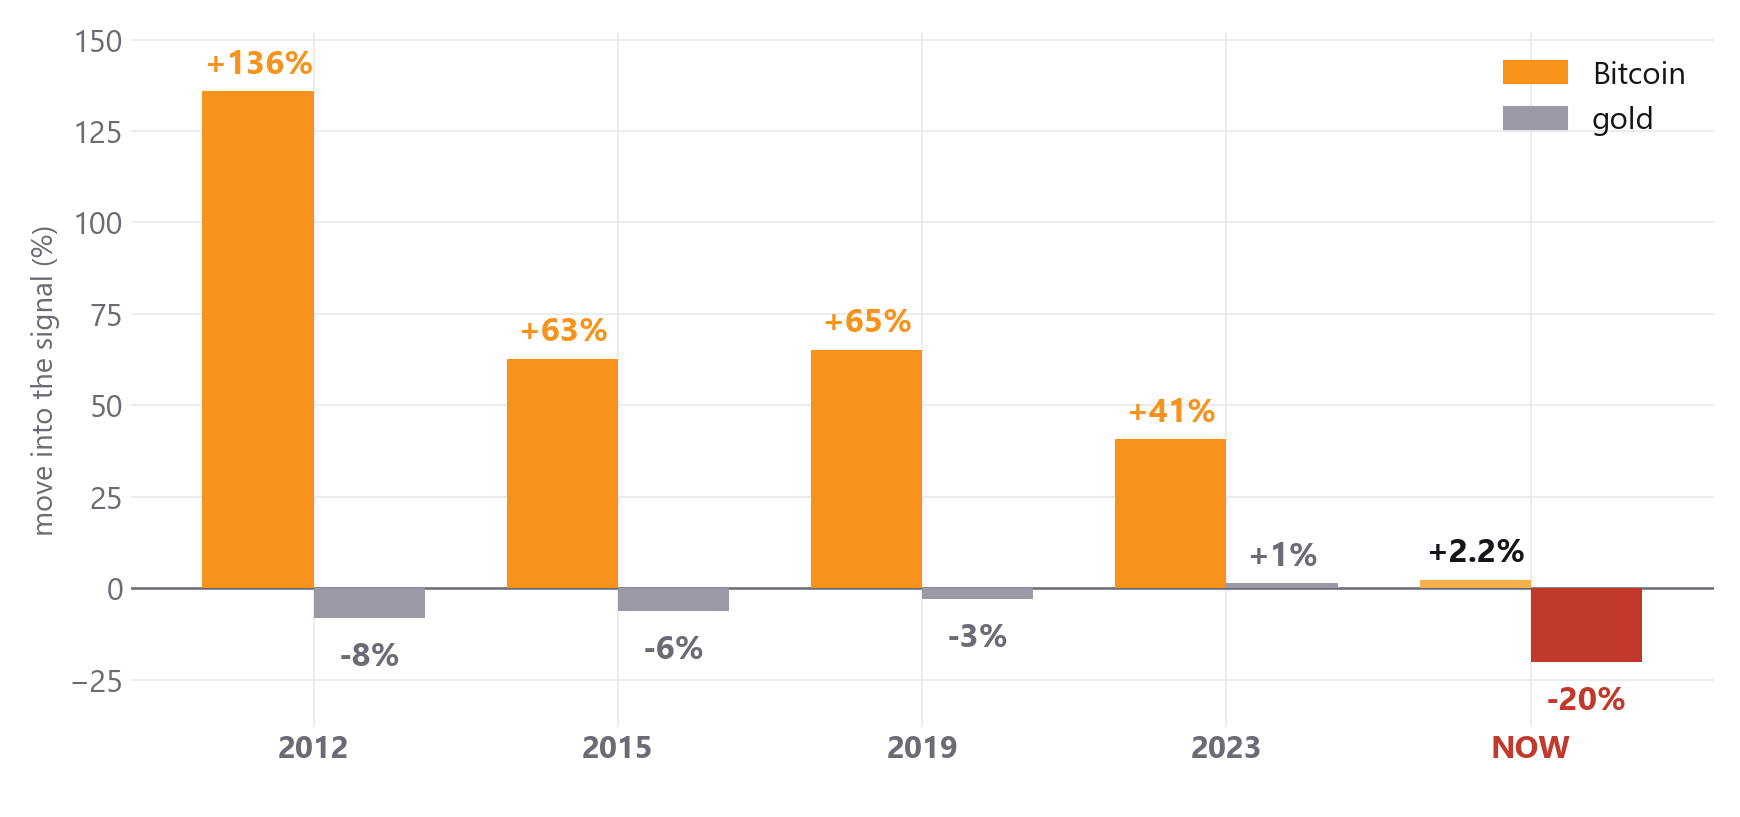
In the four real signals, Bitcoin ripped 41% to 136% into the cross while gold barely moved. In 2023 gold was actually rising against it and Bitcoin powered through anyway. And across all 42 crosses in fifteen years, gold never once fell even 5% in the six weeks before a signal. The deepest gold decline that ever helped produce one was 4.3%. Every cross this indicator ever printed was a Bitcoin move. Gold was never the reason.
2026 is running on the wrong engine
Now look at what is producing the current reclaim. Gold peaked at a record $5,318 in January 2026 and has crashed 20% since February, falling below its own 200-day trend line. Bitcoin has added just 2.2% in the exact same window.
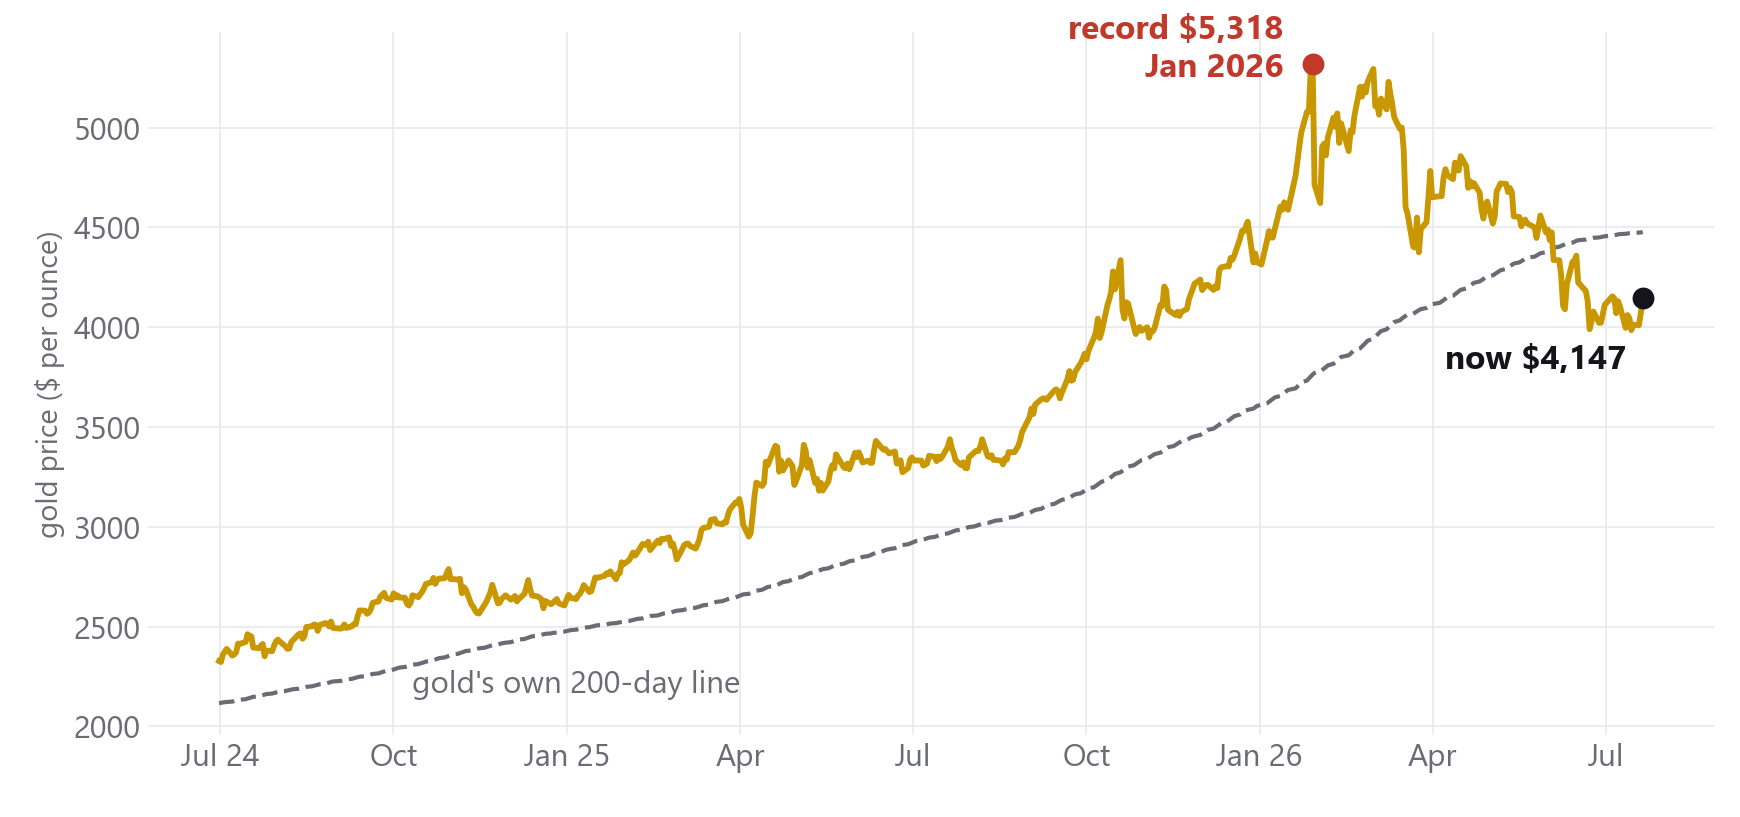
Roughly nine tenths of the ratio's recovery is gold falling, not Bitcoin rising. The cleanest way to see it is a simple counterfactual. For today's ratio to have come from Bitcoin strength, with gold steady at its February price, Bitcoin would need to trade near $83,000. It trades near $66,101. The line moved because gold collapsed.
A bottom signal is supposed to measure Bitcoin demand roaring back. Right now it is measuring a gold crash. The cross on the chart will look identical either way. The meaning could not be more different.
What to watch instead of the cross
The honest playbook has three checks, and anyone can run them in under a minute.
First, when the cross prints, look at both prices instead of the ratio. Did Bitcoin go up, or did gold go down? That one question separates every real signal in history from the current setup.
Second, let it hold. 31 of the 42 historical crosses died within a month. A reclaim that matters stays reclaimed for weeks.
Third, demand the timing. Every real signal fired a year or more after the cycle top, at or past the actual low. Early reclaims have a perfect record of failure.
We packaged the full audit, every chart, every number and all 42 signals, into a free guide you can keep. Bitcoin vs Gold, The Full Deep Dive is available now in the guides section.
Four real signals is a tiny sample, and history is a record of what happened, not a promise of what comes next. But if you are going to trade a famous signal, you should at least know what is moving it. This time, it is not Bitcoin.
Common questions
What is the Bitcoin to gold ratio?
It is Bitcoin's price divided by the price of gold, which tells you how many ounces of gold one Bitcoin is worth. Right now one Bitcoin buys about 15.9 ounces. Analysts track it against its 200-day average to judge Bitcoin's strength in hard-money terms instead of dollars.
Has the Bitcoin gold 200-day cross really called every bear market bottom?
The four famous signals in 2012, 2015, 2019 and 2023 did hold, but they fired 48% to 135% above the exact lows, and the same line crossed up 42 times in total since 2011. 17 of those crosses were followed by another 45% drop or worse within a year, so the perfect record only exists after removing the failures.
Why is the 2026 signal different from the previous ones?
In every previous real signal, Bitcoin was rallying hard into the cross, 41% to 136%, while gold stayed roughly flat. In 2026 Bitcoin has added about 2.2% since February while gold has crashed 20% from its January record, so the ratio is rising mainly because gold is falling. That engine has no precedent in the signal's history.
Keep reading
We break down the market like this every day, free on Instagram and YouTube, and in depth inside the community.
Education, not financial advice. Trading involves real risk.