Bitcoin in November: What the Data Actually Shows
Every year around Halloween, the same question circulates. What does bitcoin in November actually look like? The average answer sounds encouraging. Roughly 34 percent mean return. Ten gains in sixteen Novembers since 2010. On paper, the calendar looks friendly.
But averages in Bitcoin can mislead. This one does more than most.
The November record, all sixteen years
Since Bitcoin first had a full November in 2010, the month has closed positive ten times and negative six times. That is a better-than-coin-flip hit rate, and it is real. More years up than down is a real pattern.
The average return across all sixteen Novembers is about 34.59 percent. The problem is that number is doing a lot of work on the back of a single year. November 2013 alone was up 453 percent. Pull that year out and the average looks completely different. The median return across all Novembers is closer to 10 percent. That is the number worth anchoring to.
Here is what the record actually looks like, without the spin:
- November 2013: +453% (outlier that drives the average)
- November 2020: +43%
- November 2024: +37%
- November 2017: +54%
- November 2023: +9%
- November 2025: -17%
- November 2022: -16%
- November 2018: -37%
See the pattern in the negative column? Every single losing November came during a bear market or a period of serious macro stress. The calendar did not override those conditions. It got absorbed by them.
What the bear-market Novembers have in common
November 2018 was the worst on record. Bitcoin lost 37 percent that month, the final brutal leg of the crash that started in early 2018. By November, the mood was already broken. The seasonality that worked in 2017 did nothing one year later.
November 2022 brought the FTX collapse. Down 16 percent. Again, the calendar meant nothing when the structural story was bad.
November 2025 was down 17 percent. No single headline broke it. The market was already in a slow grind lower, and November showed up and kept grinding.
In every one of those years, people citing the seasonality were not wrong about the historical average. They were wrong about what drives the month. The calendar is not the driver. Where Bitcoin sits in its broader cycle is the driver.
What actually moves November
When November has been great, it has almost always come when Bitcoin was already in recovery mode or mid-bull. The 2013 explosion came at the height of the first real bull run. The 2020 surge happened when institutional money was flooding in. November 2024 popped after the ETF approval year and months of building momentum.
When November has been bad, Bitcoin was already broken before October ended. The month does not have magical healing properties. It reflects the setup that already exists.
The fear and greed index is worth watching here. In every bear-market November, fear was already elevated before the month began. The index does not predict what the month will do, but a reading stuck below 40 heading into November has historically gone with the negative outcomes more often than not.
Right now, fear and greed sits at 34. Fear. That is not automatically a signal in either direction, but it is worth knowing which side of the historical ledger that puts you on.
What the data says for right now
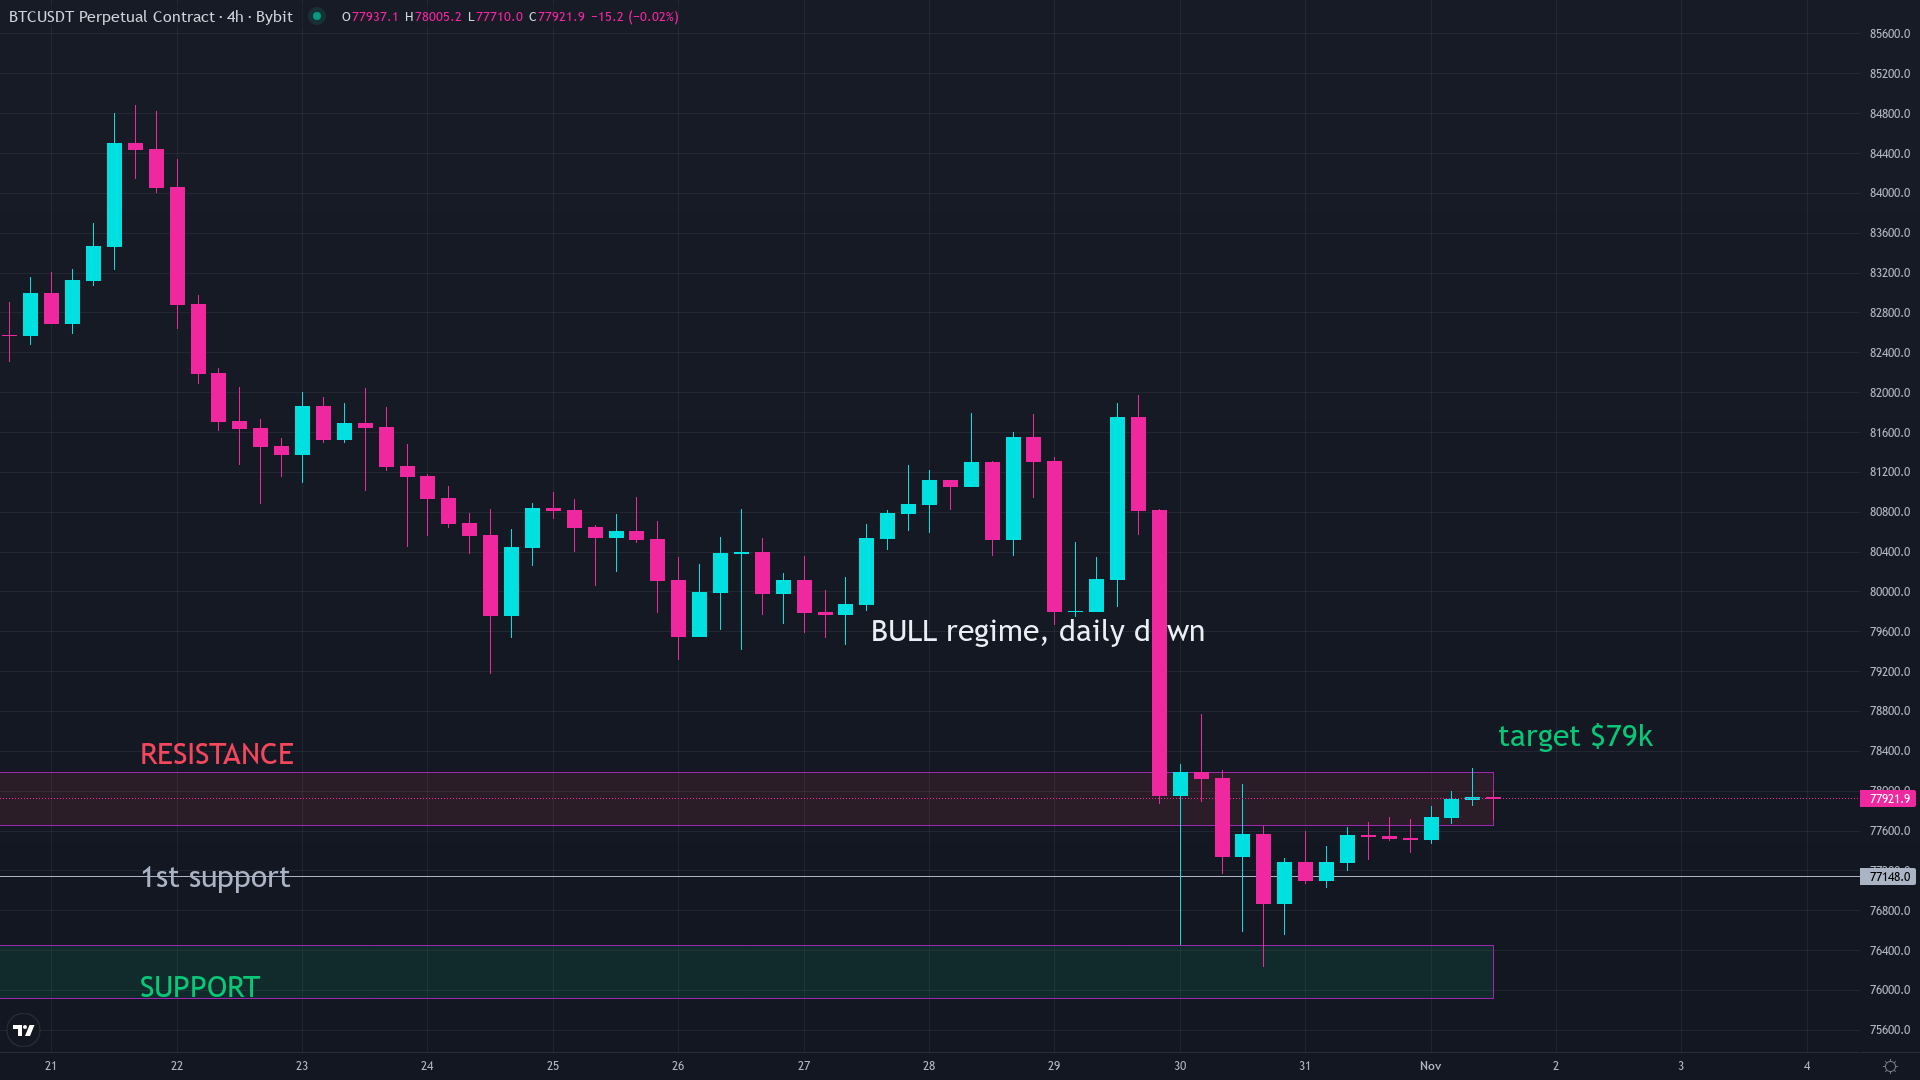
Bitcoin is at $77,915 as November opens. The trend on the daily chart is down. The trend on the four-hour chart is down. The market is not in recovery mode, at least not yet.
That puts this November closer to 2018, 2022, and 2025 than to 2020 or 2024 in terms of setup. That does not mean it is guaranteed to be red. Bear market Novembers have recovered mid-month before. But the setup that has preceded every great November is not what is sitting in front of us right now.
The honest read is this: November has a real statistical edge over the long run. But that edge has never shown up when the broader structure was still pointing down. Every time Bitcoin looked like it does today heading into November, the month was negative.
That could change. The setup can shift. But if you are making a plan based on “November is historically the best month,” you are anchoring to the average when the conditions look a lot more like the outliers on the other side.
Learn more about how Bitcoin behaves across every phase of its market in our full Bitcoin crash history and see the broader fourth-quarter picture in Bitcoin in Q4: Is the Best Quarter Real?
Common questions
Is November good for bitcoin?
On average, yes. Bitcoin has finished November positive 10 out of 16 years since 2010. But every bear-market November has closed negative, so the context matters as much as the calendar.
What has bitcoin done in November historically?
The average return is about 34.59%, but that is pulled up by a single outlier year (2013, +453%). The median November return is closer to 10%, and bear-market years like 2018, 2022, and 2025 all saw losses.
What was bitcoin's worst November?
November 2018, when Bitcoin lost roughly 37% during the late stage of the 2018 bear market. It remains the single worst November on record.
Does bitcoin always go up in November?
No. Six of the sixteen Novembers since 2010 have been negative. All six came during bear markets or periods of major market stress. The month does not override poor underlying conditions.
Should I buy bitcoin in November?
That depends on where Bitcoin is in its cycle, not what month it is. November has a real long-term edge, but every time it has failed it was because the broader trend was already pointing lower before the month began.
Keep reading
We break down the market like this every day, free on Instagram and YouTube, and in depth inside the community.
Education, not financial advice. Trading involves real risk.