The Bitcoin Power Law, Explained: Fair Value, the Floor, and the Bottom
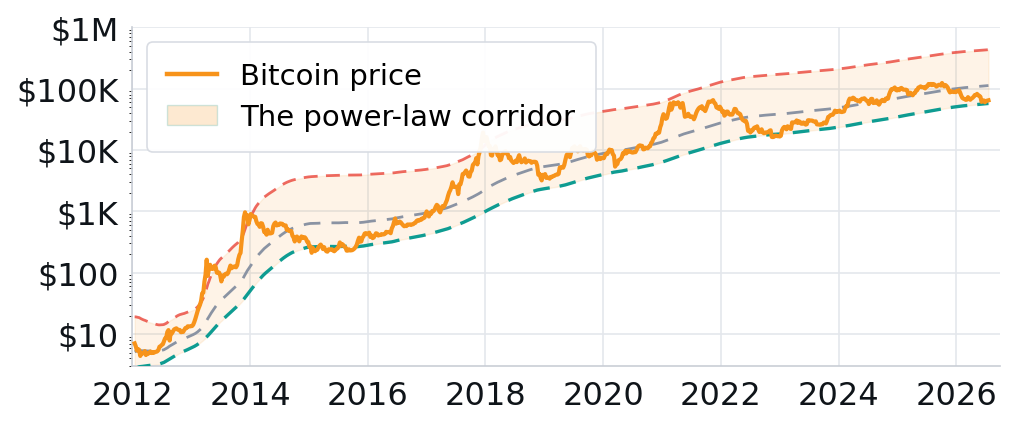
Every few weeks, someone hands you an exact number for where Bitcoin will bottom. You can safely ignore all of them. There is one line that actually deserves your attention, and the reason it is worth trusting is that it refuses to give you a single price. It gives you a zone. It is called the power law, and Bitcoin has bounced off it at every major crash for fifteen years.
What the power law actually is
Bitcoin does not grow like a normal company. A stock grows with its profits. Bitcoin grows on a path set by time itself, the same slow, compounding way a city grows or the internet spread. Plot its price the normal way and it looks like pure chaos, a series of violent booms and busts that seem to follow no rule at all.
Now plot it on a log chart, the kind that turns huge multiplying moves into even steps. The chaos flattens into something almost boring. A straight, rising channel that fifteen years of price has stayed inside. That channel is the power law. Wild in the short term, remarkably straight over the long run.
Fair value is the middle of the channel
The center of that channel is the closest thing Bitcoin has to a fair value. Price almost never sits exactly on it. In every bull market it rockets far above the line, into bubble territory. In every bear it sinks far below, into fear. Then, over and over, it gets pulled back toward the middle. The line behaves like gravity.
Today Bitcoin is trading below that fair-value line, down in the lower half of the channel, roughly forty percent under the model's fair value. That is the same zone it has visited in every past bear market. Below the line is where the fear always is, and historically it has also been where the value was. You can watch the live version of this corridor on our cycle page.
Can it call the exact bottom? No.
Here is the question everyone actually wants answered. Can the power law hand you the exact price Bitcoin will bottom at? The honest answer is no, and this is the part most people selling you a bottom price will skip.
The lower edge of the channel gets called a floor, and Bitcoin has bounced off it at every major low, in 2015, 2018 and 2022. But it is a statistical band, not a hard floor, and price has closed below it before. In early 2015 Bitcoin fell as much as a third under the band. In late 2022 it dipped about twelve percent below. Only the 2018 low held cleanly above it. So the line marks a zone where value has tended to be, not a guaranteed price.
This is not just our caveat. Giovanni Santostasi, the physicist who created the Bitcoin power law, describes that lower line as a theoretical floor rather than a guaranteed support level, and has said plainly that there is no guarantee the floor will hold. The person who built the model is the first to tell you the floor can break.
What the power law is genuinely good at is timing and range. It tells you which neighborhood Bitcoin is in and roughly when a low tends to arrive. It is weak at naming the exact dollar. Anyone printing you a precise bottom price, even one drawn off this very line, is guessing.
Why we built our own version
There is a catch with the standard power law that almost nobody mentions. It draws its line using all of the data, including the future. Fitting a line through fifteen years of price and then being impressed that price fits the line is a little like grading a test after peeking at the answers. Of course it looks accurate.
So we rebuilt it the honest way, letting the model only ever see the past and updating one day at a time, the way a real forecaster has to. The result was the interesting part. Even with no peeking, Bitcoin still hugged the line. A model that only works with hindsight is a story. One that still works when it can only use the past is closer to an edge. That walk-forward version is the one we trust, and it is why we stopped arguing about this online and published an actual research paper on it.
What to take from it
The power law will not tell you the day or the dollar. What it gives you is perspective. A fair value to measure fear against. A band history keeps respecting. A window for when the next low tends to land. In a market full of confident guesses, a model that is honest about what it cannot do is worth more than one that promises a magic number.
None of this is financial advice, and Bitcoin is volatile. History is never a promise. If you want the plain-English version of all of this, the line, fair value, the floor myth, and how to read where Bitcoin sits today, we put it in a free guide. And if you want the live read, the one we update every morning as the window gets closer, that lives inside the community.
Common questions
What is the Bitcoin power law?
The power law is a model that says Bitcoin's price grows along a path set by time, not by profits like a stock. On a log chart, Bitcoin's whole fifteen-year history has stayed inside one rising, roughly straight channel. The middle of that channel acts like a fair value that price is repeatedly pulled back toward.
Does the Bitcoin power law predict the bottom price?
Not exactly. It gives you a zone and a rough window in time, not a single price. The lower band is a statistical support level, not a hard floor. Bitcoin has closed below it before, as much as about a third under in 2015 and roughly twelve percent under in 2022, and only the 2018 low held cleanly above it.
Who created the Bitcoin power law?
Physicist Giovanni Santostasi is credited with the Bitcoin power law theory. Notably, he describes the lower band as a theoretical floor rather than a guaranteed support level and has said there is no guarantee the floor will hold, so the model's own creator is clear that it is not a promised bottom price.
Keep reading
We break down the market like this every day, free on Instagram and YouTube, and in depth inside the community.
Education, not financial advice. Trading involves real risk.