Bitcoin Price History: Every Cycle From $0 to $126K
Bitcoin went from literally worthless to $126,272 in sixteen years. Along the way it crashed five times by more than 50%, got declared dead over 400 times, and still sits higher than every previous cycle peak except its own. That is the full Bitcoin price history in one sentence. The rest of this article is the evidence.
2009 to 2010: Bitcoin price starts at zero
For its first year, Bitcoin had no market price. The network launched in January 2009, and the first coins were mined on ordinary laptops. No exchange. No order book. No way to buy or sell.
The first real transaction happened on May 22, 2010. A programmer paid 10,000 BTC for two pizzas, valued at roughly $41 total, about $0.004 per coin. Those pizzas, at today’s price, would cost over $780 million. By the end of 2010, Bitcoin traded near $0.30.
2011: the first boom and the first crash
Bitcoin crossed $1 in February 2011, hit $31 by June, and then crashed to $2 by November. A 94% wipeout. The cause was a combination of a Mt. Gox hack and the sheer fragility of a brand-new market with almost no liquidity.
Most people who heard about Bitcoin during this run assumed it was finished. The ones who bought at $2 multiplied their money by 575 times over the next two years.
2013: the first headline cycle
Bitcoin ran from under $15 in January 2013 to $1,150 by November. This was the first cycle that mainstream media covered seriously. The price spike was driven by the Cyprus banking crisis, Chinese retail demand, and raw speculation.
Then it crashed. By January 2015, Bitcoin sat at $152. An 87% drop from the peak. The narrative shifted from “digital gold” to “dead experiment” almost overnight. Mt. Gox collapsed. Regulators circled. Google searches for “Bitcoin” dropped to near zero.
2017: Bitcoin goes mainstream
The 2017 bull run is the one most people remember. Bitcoin went from $1,000 in January to nearly $19,800 in December. Your Uber driver was talking about it. Your aunt was asking how to buy it. Futures launched on the CME in December, and the peak came within a week.
The crash that followed took Bitcoin to about $3,200 by December 2018. An 84% collapse. It took over a year to grind to the bottom, and another year after that before the price reclaimed the old high. The bear market lasted 364 days from peak to trough.
2021: institutions arrive, then the floor drops
The 2020 to 2021 cycle was different in structure. Bitcoin hit $64,000 in April 2021, crashed to $29,000 by summer (China banned mining), then ran to $69,000 by November. This was the first cycle with serious institutional involvement: Tesla, MicroStrategy, and the first Bitcoin futures ETFs all entered during this period.
The crash took Bitcoin to roughly $15,500 by November 2022. A 77% drop. FTX collapsed. Luna had already imploded. The entire crypto lending complex blew up. The narrative, once again, was that Bitcoin was finished.
Each of those crashes was brutal. But notice the pattern: 94%, 87%, 84%, 77%. Every crash has been smaller than the one before it.
2025: the current cycle peak and where we sit now
Bitcoin hit its all-time high of $126,272 on October 6, 2025. The catalyst this time was the spot Bitcoin ETF, which launched in January 2024 and pulled billions of dollars from traditional finance into Bitcoin for the first time.
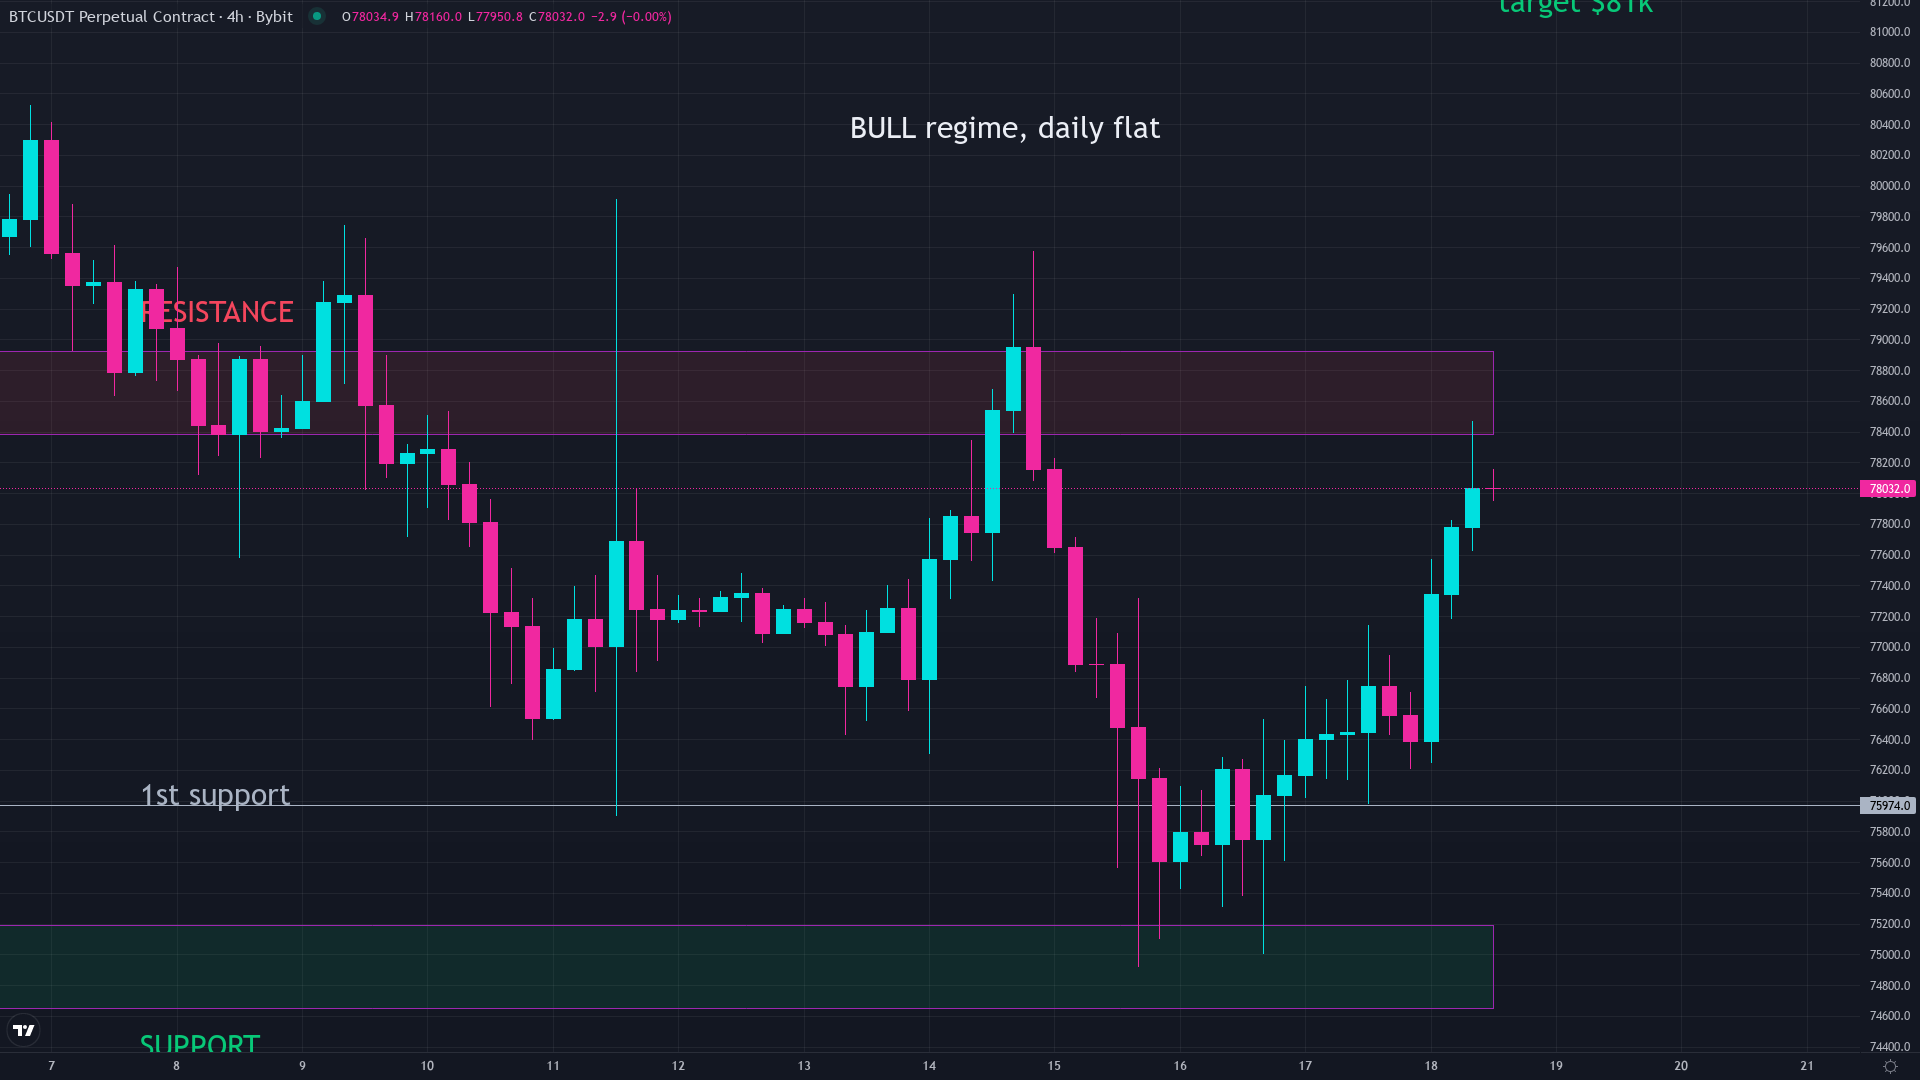
Since that peak, Bitcoin has fallen to the mid-$70,000 range. As of September 2026, it sits near $78,000, roughly 38% below the high. We are 347 days past the cycle top.
Is this crash different? In size, it is tracking smaller than every previous one. In structure, it looks exactly the same. The four-year cycle has now repeated five times, and the shape has not changed: a run-up after the halving, a blow-off top, a long grind down, and then a bottoming process that most people are too exhausted to notice.
The pattern inside the Bitcoin price history
Every cycle follows roughly the same four acts:
- Recovery. Bitcoin climbs back from the previous crash. Headlines are quiet. Nobody is impressed yet.
- The halving cuts new supply. Every four years, the mining reward gets cut in half. Less new Bitcoin entering the market while demand holds or grows creates a squeeze that precedes the blow-off run.
- Blow-off top. Retail floods in, leverage builds, prices go vertical. Every top has been marked by extreme greed and the belief that this time it never comes back down.
- The crash. Leverage gets liquidated. Weak hands sell. The crash runs until the last forced seller is gone.
This pattern has held through five cycles, across completely different market structures and global economies. The players changed, the amounts got larger, and the shape stayed the same.
What Bitcoin price history actually teaches
The lesson is not “Bitcoin always goes up.” It does, on a long enough timeline, but that ignores the 77 to 94% crashes along the way. Saying “just hold” to someone who bought the 2021 top at $69,000 and watched it fall to $15,500 misses the reality of watching two-thirds of your money vanish.
The real lesson is simpler. Every crash in Bitcoin price history looked like the end. Every single one. And every one was followed by a new all-time high. Not quickly. Not painlessly. But without exception.
The people who panicked in every crash sold their coins to the people who kept their heads. That transfer, repeated across five cycles, is the entire story of the Bitcoin investment thesis in one sentence.
Common questions
What was Bitcoin's highest price ever?
Bitcoin reached its all-time high of $126,272 on October 6, 2025, during the cycle driven by the first spot Bitcoin ETFs.
How many times has Bitcoin crashed more than 50%?
Five times. Bitcoin dropped 94% in 2011, 87% in 2013-2015, 84% in 2017-2018, 77% in 2021-2022, and roughly 38% so far in the current cycle. Each crash has been smaller than the one before.
Does Bitcoin always recover after a crash?
Every crash in Bitcoin price history has been followed by a new all-time high. The recoveries have taken anywhere from one to three years, and none of them were painless, but so far the pattern has held across five full cycles.
What is the Bitcoin four-year cycle?
Bitcoin tends to move in roughly four-year cycles aligned with the halving, the event that cuts new supply in half. Each cycle has followed the same shape: a recovery, a supply squeeze after the halving, a blow-off top, and a long crash that resets the market.
How much was Bitcoin worth when it started?
Bitcoin had no market price for its first year. The first transaction that gave it a dollar value was the famous pizza purchase in May 2010, which priced Bitcoin at roughly $0.004 per coin.
Keep reading
We break down the market like this every day, free on Instagram and YouTube, and in depth inside the community.
Education, not financial advice. Trading involves real risk.