Bitcoin Red May, Red June: Does July Bounce?
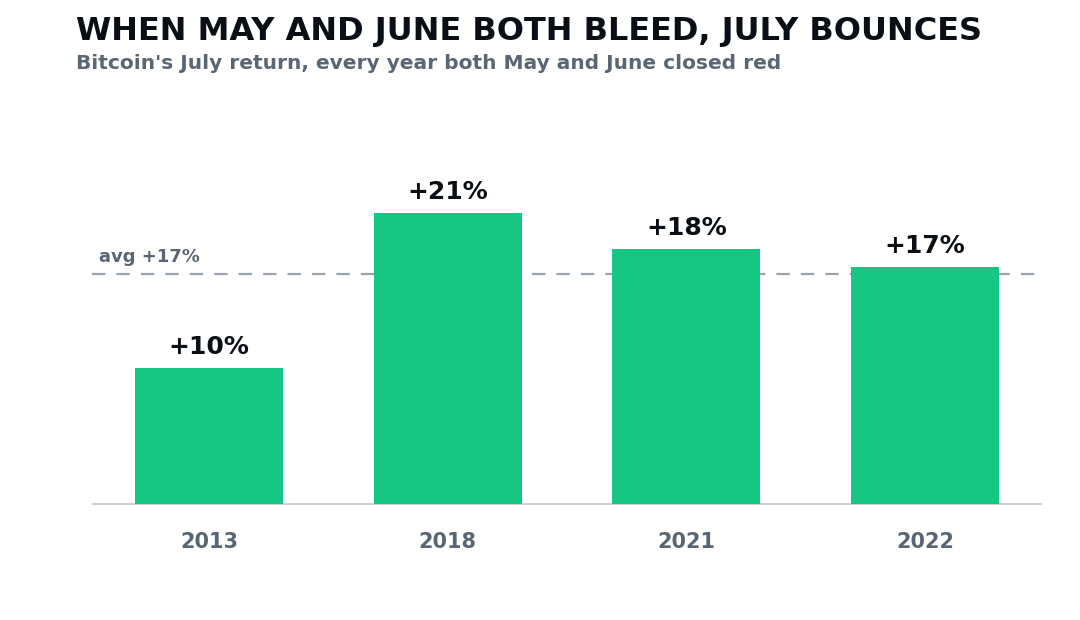
Here is a fact that should not get lost in the gloom. When Bitcoin closes a red May and a red June back to back, July has bounced every single time. It is rare. Since 2013 it has happened in only four years. And in all four, the very next month came back green. That is what people are circling when they ask whether Bitcoin red May red June means a July bounce is coming. Let me lay out the real record, and then the part the pump crowd skips.
First, what makes this different from the usual July talk. Plenty of people will tell you July tends to be kind to Bitcoin in general. That is true, and we covered the full month-by-month case in Bitcoin July seasonality. This is a tighter, rarer signal. Not just any July. The July that follows two red months in a row.
Bitcoin red May, red June: the 4 for 4 record
Go back through every year since 2013 and find the ones where Bitcoin closed lower in May and then closed lower again in June. Two losing months stacked on top of each other. It has happened exactly four times: 2013, 2018, 2021, and 2022.
Here is what July did each of those four times:
- 2013: July finished up about 10%.
- 2018: July finished up about 21%.
- 2021: July finished up about 18%.
- 2022: July finished up about 17%.
Four setups. Four green Julys. Zero misses. The average bounce was close to 17%. So when someone asks does Bitcoin bounce after a bad June, this little four-year record is the cleanest yes they can point to.
Why 2026 looks like the fifth setup
Now look at where we are. May 2026 closed red, down about 4%. June is closing red too, and not by a little. It is on track to finish down around 18%, one of the worst months this whole bear market. Bitcoin is sitting roughly 52% below its all-time high, around day 266 of the downtrend.
One honest note on timing. June is not officially closed until the 30th, so the exact number can still shift. But barring a sudden 18% rip in two days, June closes red, and 2026 becomes the fifth time Bitcoin has stacked a red May on a red June. The same setup that came before four green Julys.
The honest catch nobody puts on the flyer
This is the part I will not let you skip, because four-for-four is exactly the kind of clean stat that gets people hurt.
The first catch is the sample. Four years is tiny. A streak that short can be a real signal, or it can be plain luck, and a sample this small genuinely cannot tell you which. It tilts the odds. It is not a law. Four green Julys do not guarantee a fifth.
The second catch is bigger, and it is the one that matters most right now. A green July is not the same as the bottom. We have a perfect receipt for this, and it comes from the most recent matching year. In 2022, Bitcoin bounced about 29% off its June low into July. It felt like the worst was over. Then it rolled back down and made a fresh low in November, roughly 17% below that summer floor. The July bounce was completely real. It just was not the bottom.
So the edge here is near-term. It is strongest over the next month or two and fades by about three months out. That is the honest shape of it. A bounce you can believe in, and a final low that may still be ahead. Both can be true in the same summer.
Same trigger, different weather
One more thing, so you read this correctly. The trigger is identical across all four years. Two red months in a row. But the weather around them was not the same. In 2013 and 2021, Bitcoin was in a bull market and those red months were just a pause inside a bigger uptrend. In 2018 and 2022, it was a real bear market, the kind we are in now.
So the matching pattern is the trigger, not a promise that 2026 plays out like any one of those years. The two years that look most like today, 2018 and 2022, both still gave a green July. But 2022 also reminds you what can come after. Treat this as a pattern that raises the odds, not a copy-paste of a past chart.
What to actually do with it
Use this the way you would use a weather forecast, not a guarantee. The setup leans green. The bear market may not be over. Knowing both at once is the whole point. Anyone selling you only the bullish half, four-for-four with no caveat, is doing you a disservice. And if you want the wider month-by-month view this rare signal sits inside, the Bitcoin July seasonality breakdown has the full record.
I pulled this two-red-month pattern, the full July record, and exactly where the bounce can still trap you into one free guide called The July Playbook. You can grab it at bitcoin-daily.com/guides/july-playbook.pdf, or comment JULY2026 on our Instagram and we will send it over. And if you want the data walked through every day alongside other people holding through this, that is what the community is for.
Common questions
What happens to Bitcoin after a red May and a red June?
Since 2013, Bitcoin has closed both May and June red four times, in 2013, 2018, 2021, and 2022. July finished green all four times, up about 10%, 21%, 18%, and 17%, an average bounce near 17%. It is a strong lean, but four years is a tiny sample, not a law.
Does Bitcoin bounce after a bad June?
Historically, after the rare case of both May and June closing red, yes, July has bounced four for four. But a bounce is not the same as the bottom. In 2022 Bitcoin bounced hard in July and still made a new low months later.
Is 2026 setting up the same red May, red June pattern?
It is on track. May 2026 closed down about 4% and June is closing red, around 18% down, which would make 2026 the fifth time Bitcoin has stacked a red May on a red June since 2013. June is not officially closed until the 30th, so the final number can still shift.
Does a green July mean the Bitcoin bottom is in?
No. A green July can be a real relief bounce inside a larger downtrend that later rolls over to a new low. The clearest example is 2022, where July bounced about 29% off the June low and Bitcoin still made a fresh low in November, roughly 17% lower.
How reliable is the red May, red June into July pattern?
The record is perfect at four for four, but the sample is only four years, so treat it as a tilt in the odds rather than a guarantee. The edge is near-term, strongest over one to two months, and fades by about three months out.
Keep reading
We break down the market like this every day, free on Instagram and YouTube, and in depth inside the community.
Education, not financial advice. Trading involves real risk.