Bitcoin Support and Resistance Explained (Why Obvious Levels Get Hunted)
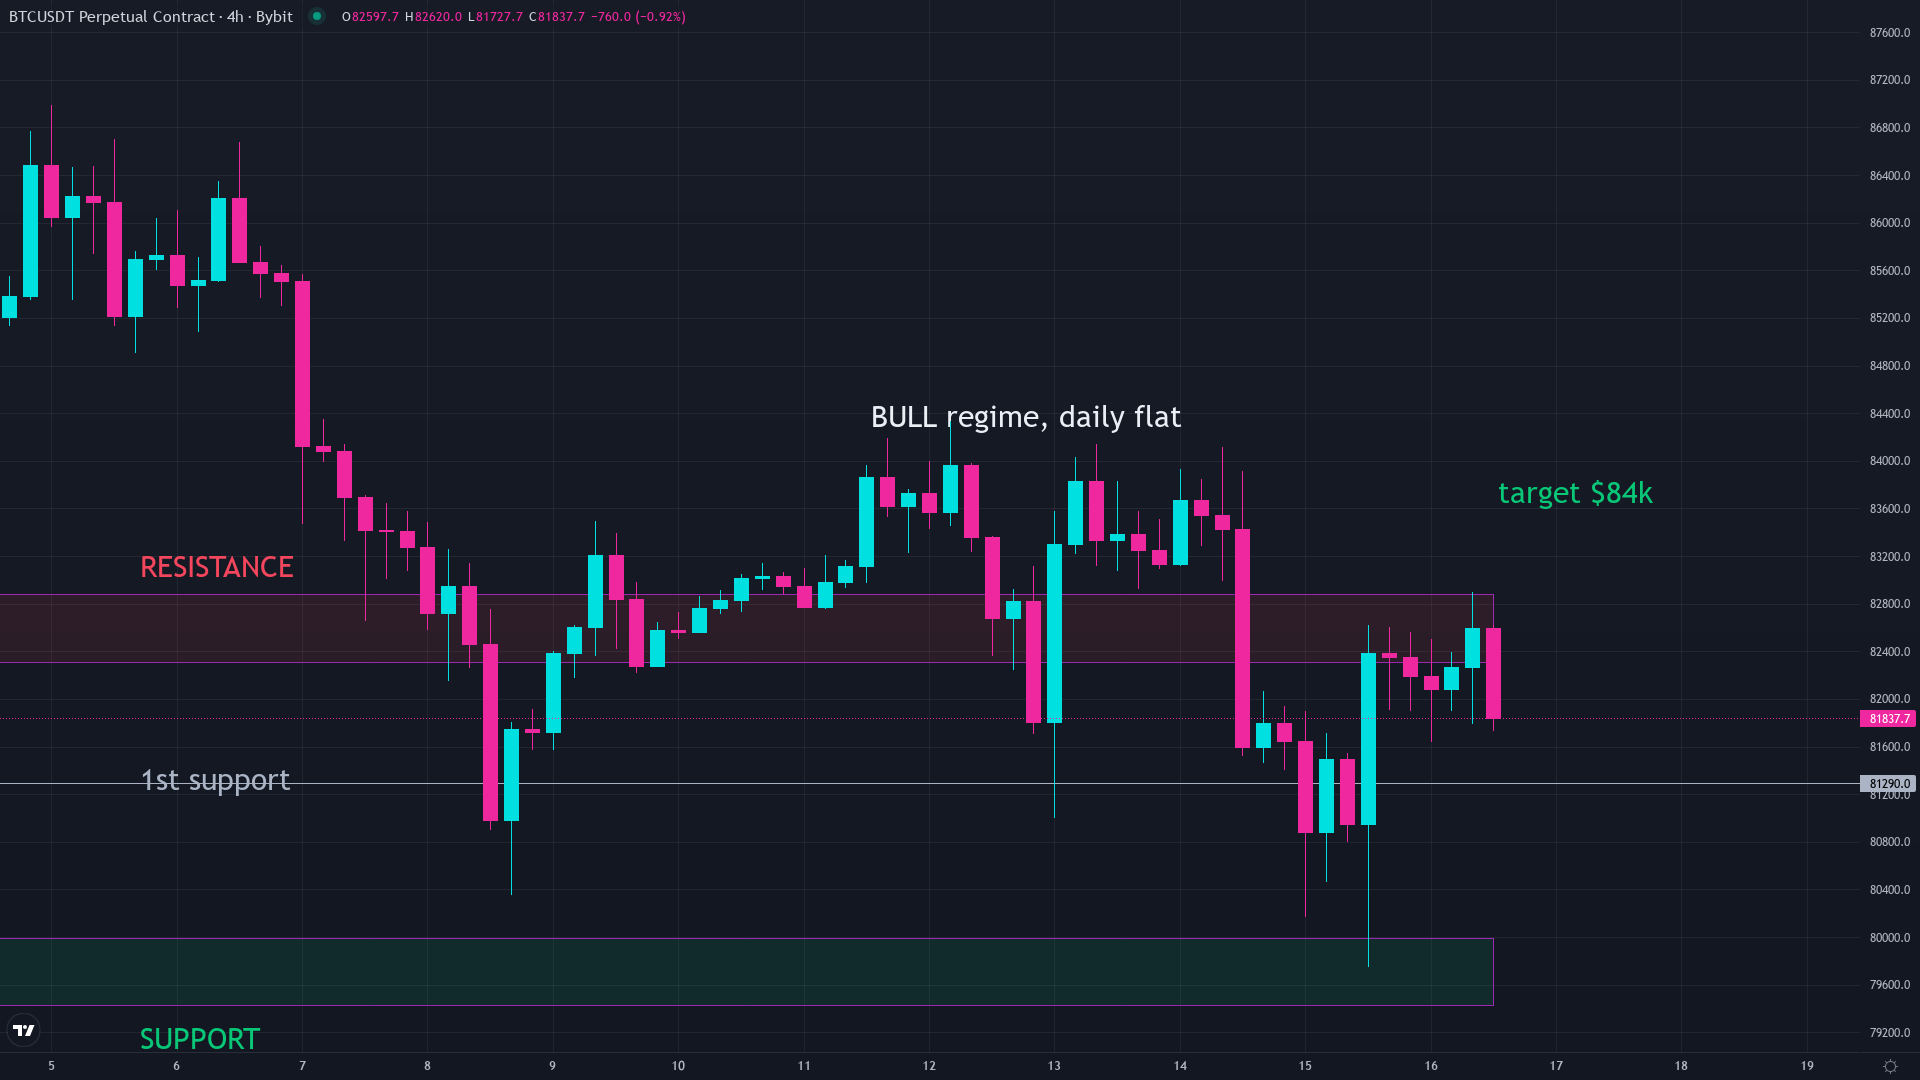
Draw the same bitcoin support line as ten thousand other traders, and you have not found safety. You have joined the crowd that gets swept out before the real move starts. Once you understand why, you will never look at a price chart the same way.
Bitcoin support and resistance are the most-taught concepts in crypto trading. They are also the most misused. This is the plain-English version of what those levels actually mean, why the obvious ones keep failing, and how to use them so a sweep does not end your trade at the worst possible moment.
What bitcoin support and resistance actually mean
A support level is a price zone where buyers showed up before and pushed the market higher. A resistance level is where sellers showed up and pushed it lower. Think of them as price zones where supply and demand had a visible argument, and one side won.
The logic is sound: if buyers defended a certain price before, they might defend it again. If sellers appeared at a ceiling before, they could appear again. That part is not wrong. The problem is what most traders do with it.
Why the obvious support levels get hunted
Open any Bitcoin chart right now. Draw a line at the last clear low. Odds are, thousands of other traders drew the exact same line this morning.
That creates something very specific: a dense pile of buy orders sitting at that level, and stop orders clustered just below it, placed by people already in the trade. For a large enough player moving enough size, that cluster is not a barrier. It is a refueling station.
They push the price down through the support level, trigger the stops, collect the coins the panicked sellers just handed over, and then reverse the move. Price snaps back up. The traders who held through it get nothing. The traders who put their stop just under the “obvious” line got exited right at the bottom.
This is called a liquidity sweep. It is not a theory about backroom deals. It is the market finding the fuel it needs to move, and it happens at obvious levels constantly because obvious levels are where obvious orders pile up.
What actually holds at a support zone
The strongest bitcoin support and resistance zones are not the most visible lines on the chart. They are places where several reasons to buy or sell stack on top of each other at the same price: a prior high that is also near the weekly open, also near where price spent an extended period building, also near a heavy-volume area. A single line almost never holds under real selling pressure. A zone where multiple things agree is much harder to sweep cleanly.
Look for these qualities when you are marking a level:
- Price spent time at the zone, it did not just touch and reverse. A quick spike to a price and back is thin evidence. A period of price trading back and forth inside a narrow zone means real orders transacted there on both sides.
- The level has been tested and held more than once. A single rejection is thin. Three rejections at the same zone means a real pile of orders is sitting on the other side every time price approaches.
- Old resistance that became support after a breakout. When price clears a prior high, the traders who missed the breakout wait to buy the pullback to that level. That is real demand, not a line you drew on a chart.
How to use bitcoin support and resistance without getting trapped
The real job of these levels is not to predict exactly where price will bounce. It is to help you decide where the market has to go to prove your trade wrong. Those are different goals, and the difference is what keeps a normal losing trade from becoming a damaging one.
A support zone tells you: if price drops through here and cannot recover, the trade is probably wrong. That is where your stop belongs. Not at the textbook line just under the obvious level that everyone else is watching, but at a real zone where you would have to admit the read was off.
A resistance zone tells you: this is a logical place to take partial profit or tighten a stop, because sellers have appeared here before and may again.
Across 109 live trades in my own journal, the losses that hurt most were never because the setup was wrong. They were because the stop was placed at the cosmetic location instead of the structural one. Capping risk at 1% per trade only protects you if the stop is in a real place. Put it at the right structural level and the math works as designed. Put it where everyone else puts theirs and you pay the cost of their liquidity run.
If you want to go deeper on where the edge in a trade actually lives, why exits matter more than entries breaks down exactly that. And to understand how to size a position so a swept stop does not wipe out weeks of gains, the 1% rule for crypto position sizing covers the math behind it.
Common questions
What is support and resistance in bitcoin?
Support is a price zone where buyers showed up before and pushed the market higher. Resistance is where sellers appeared and pushed it lower. Both are zones where supply and demand had a visible argument in the past, and one side won.
Why does bitcoin break through support levels?
The most obvious support levels attract a cluster of buy orders and stop orders from thousands of traders watching the same chart. That cluster becomes fuel for larger players who push price through it, trigger the stops, and then reverse the move. It happens most at the levels everyone is watching.
How do you find strong bitcoin support and resistance zones?
Look for zones where price spent extended time building, not just touched once and reversed. The strongest zones are where several things agree at the same price: a prior high, a heavy-volume area, and a key open price all stacked together.
Where should I put my stop loss relative to a support level?
Below a zone where the market would genuinely prove your trade wrong, not at the textbook spot just under the obvious line. Stops at obvious, crowded spots get swept. Stops at real structural levels have a reason to hold.
Is support and resistance reliable in bitcoin trading?
Used as a prediction tool at obvious levels, it fails often because those are where liquidity gets swept. Used as a risk management tool to decide where the market proves your trade wrong, it is one of the most practical frameworks in crypto trading.
Keep reading
- Entries vs Exits in Trading: Which One Makes You Money?
- Position Sizing in Crypto: The 1% Rule That Protects Your Account
We break down the market like this every day, free on Instagram and YouTube, and in depth inside the community.
Education, not financial advice. Trading involves real risk.