Bitcoin Uptober Explained: Is October Really Bullish?
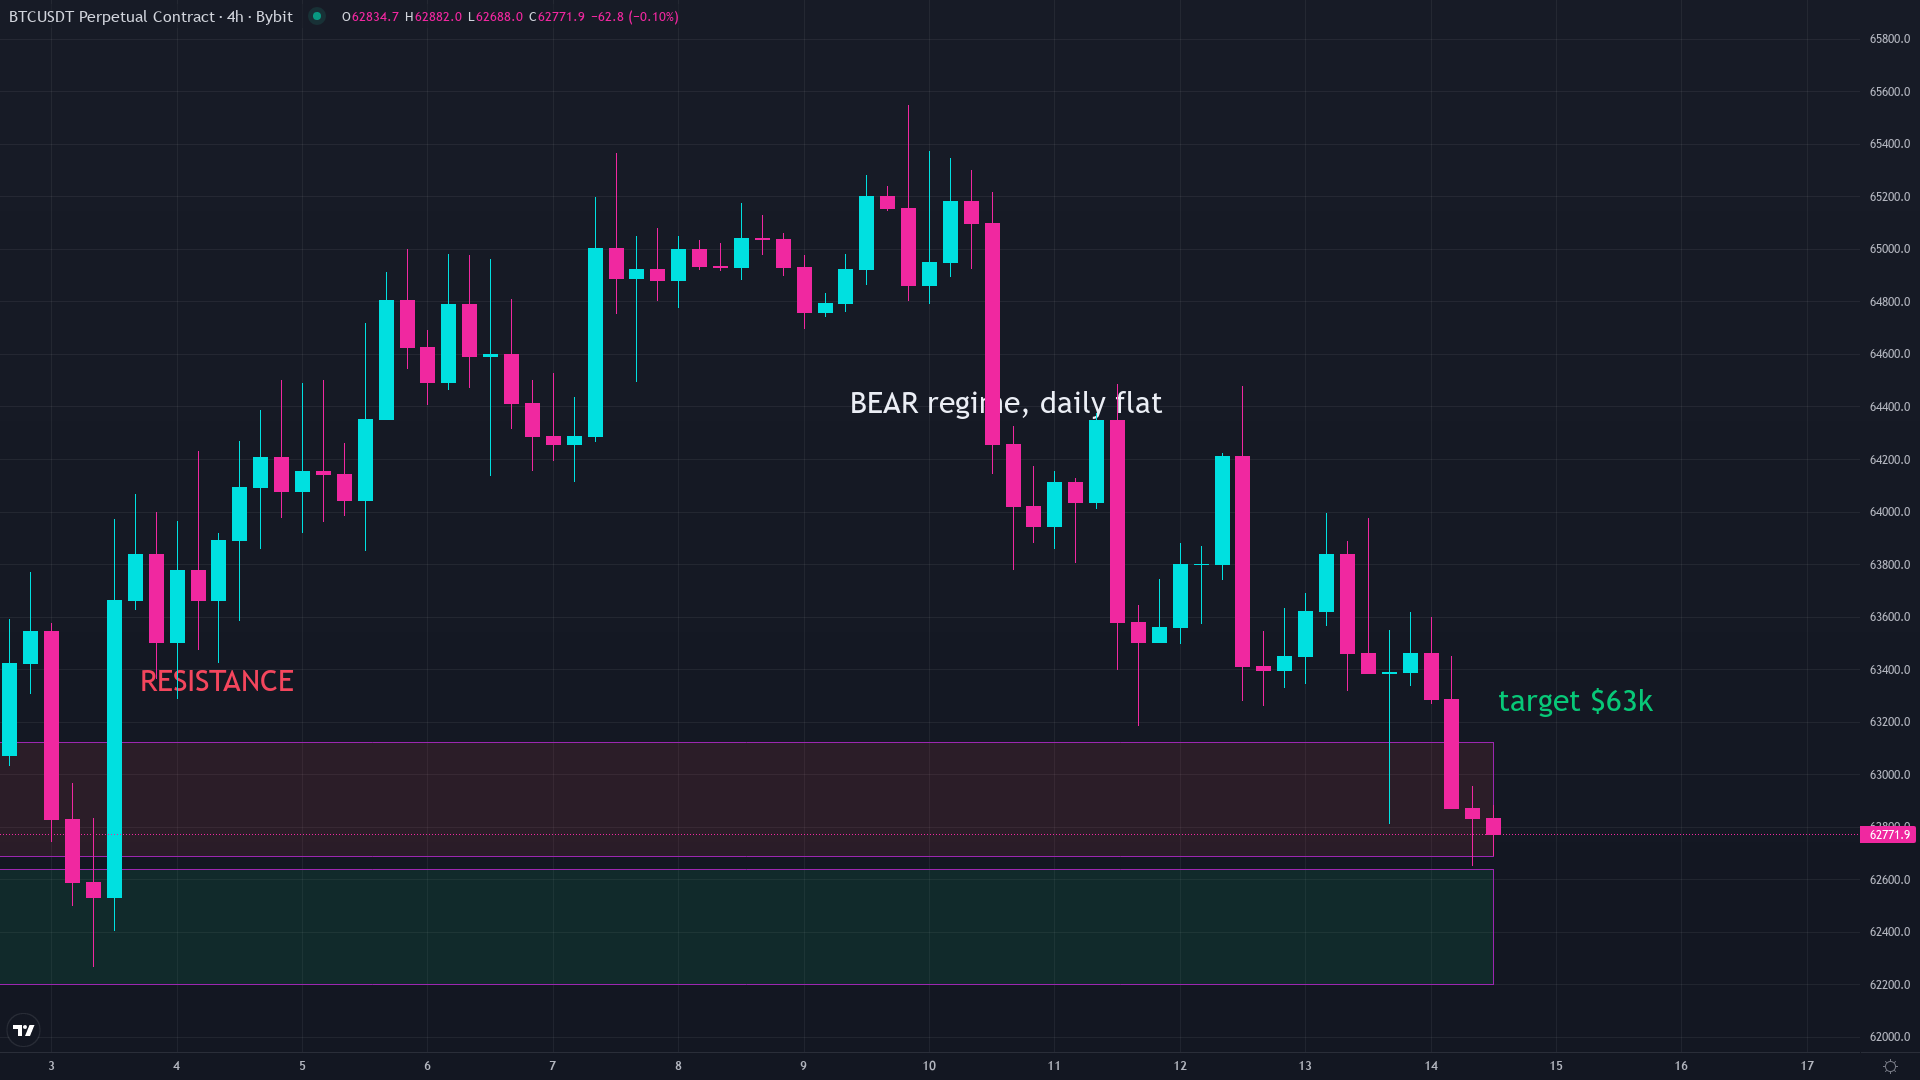
Every September, the “Uptober” posts arrive like clockwork. Charts of past October gains. Green text. The energy of people who already know what is about to happen. Then October 2025 came along, Bitcoin hit its highest price ever, and the month still closed in the red. So let’s look at what the numbers actually say.
What Is Bitcoin Uptober?
The name is short for “up October.” It caught on because the historical numbers earned it. Since 2013, Bitcoin has averaged a gain of roughly 14% in October, with a typical year seeing it up about 11%. Out of 13 Octobers from 2013 through 2025, ten closed in the green. Only three ended red.
That is a legitimate seasonal pattern. Ten out of thirteen is not a coincidence. The real question is what drives it, and more importantly, when it breaks down.
The Years Bitcoin Uptober Delivered
The big October years in Bitcoin’s history were genuinely big. October 2021 and 2023 both saw gains in the 28% to 40% range. October 2016 gained about 15%, and October 2024 added roughly 11%. The six straight positive Octobers from 2019 through 2024 averaged a 27% gain.
The reason this happens is not mysterious. Summer months run with lighter trading activity. Fewer participants are actively in the market, which means sell pressure hits price harder than it would during a busy period. As summer ends, volume tends to come back, and a market with more buyers present tends to drift upward when there is no major force pushing the other way. It is not magic. It is more people showing up.
The Three Times Uptober Failed
Bitcoin’s three red Octobers were in 2014, 2018, and 2025. What they share is more revealing than the number itself.
In 2014, Bitcoin was in the middle of a crash that had taken price down more than 80% from its 2013 peak. The seasonal tendency could not override a market full of sellers with nowhere to go. In 2018, Bitcoin had been falling all year from near $20,000 and still had months of pain ahead of it. October made no difference.
October 2025 was the strangest of the three. Bitcoin set a new all-time high above $126,000 early in the month. Then sellers came in with enough force to close the month in the red anyway. It was the first red October since 2018, snapping a run of six straight positive Octobers. The pattern did not break because the historical data was wrong. It broke because a market that has just peaked is a market full of people looking to get out, and those people do not check the calendar.
What the Bitcoin Uptober Data Is Actually Telling You
The bitcoin uptober pattern is real. It is also a tendency, not a rule. That distinction matters a lot in practice.
Every month with a positive historical average also has years where it fails. August is Bitcoin’s worst month on average, yet several Augusts have been strongly positive. The month gives the market a gentle push in one direction. It does not override what the market was already doing going in.
Look at the three failed Octobers and the common thread becomes clear. Each one happened when the market was under genuine selling pressure, with more sellers than buyers ready to step in. The ten successful ones happened in conditions where buyers were already in control or returning. October gave those markets a boost. It could not create buyers where there were none.
What This Means Going Into October 2026
Right now, Bitcoin is well below its October 2025 all-time high. The market’s fear gauge sits at 29 out of 100, in the Fear zone. The recent trend has been down. That setup is closer to the conditions in 2014 and 2018 than to the conditions in 2021 or 2023.
That is not a prediction that October 2026 will be red. It is a statement that the seasonal tendency alone cannot make the case. If buyers return and conditions shift, the pattern can work. If sellers remain in control, the calendar will not save the month.
Understanding where October lands in the bigger picture requires looking at the full cycle. The four-year cycle breakdown gives context for why certain periods tend to matter and why the same month can behave so differently depending on where Bitcoin is in that longer pattern.
The short answer on Uptober: the data is real, the pattern is legitimate, and history says October works more often than not. The longer answer is that when it fails, the market’s condition always explains why. A good month does not fix a bad market.
Common questions
What is Bitcoin Uptober?
Uptober is the nickname for Bitcoin's historically strong Octobers. Since 2013, ten of thirteen Octobers have ended positive, with an average gain of about 14% and a typical year up about 11%.
Has Bitcoin Uptober ever failed?
Yes, in 2014, 2018, and 2025. All three happened when Bitcoin was already under significant selling pressure, either deep in a bear market or following a major peak.
Is October a good time to buy Bitcoin?
The historical data says October is positive more often than not, but the pattern breaks when the broader market is in a genuine downtrend. The market's condition going in matters more than the month itself.
Why is October good for Bitcoin historically?
Trading activity typically picks up as summer ends, which is the quietest time of year for crypto markets. More buyers present generally means prices drift higher when there is no strong selling force pushing the other way.
Will October 2026 be an Uptober?
No one can say with certainty. October 2026 starts with Bitcoin well below its all-time high, which is similar to 2014 and 2018, the two prior years when the pattern failed. A seasonal tendency is not a guarantee.
Keep reading
We break down the market like this every day, free on Instagram and YouTube, and in depth inside the community.
Education, not financial advice. Trading involves real risk.