Does Bitcoin Follow the Business Cycle? 15 Years, Tested
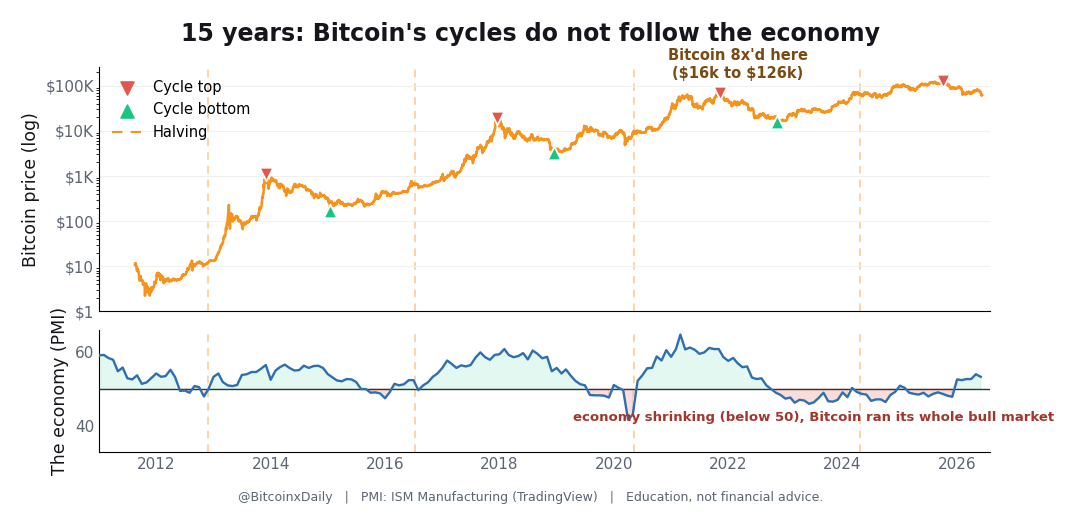
Here is the most comfortable idea in crypto right now. Bitcoin does not follow the halving anymore. It follows the business cycle. When the economy is booming, Bitcoin goes up. When the economy rolls over, Bitcoin goes down. It sounds smart, and it lets you stop timing anything. You just wait for the economy to turn and get rich.
So does Bitcoin follow the business cycle? I put 15 years of Bitcoin next to the economy and measured it. The short answer is no. The link came back at basically zero. The one thing that keeps lining up with every cycle is the halving. Not because the halving is some magic fuel, but because it sets the schedule the cycle runs on. Let me show you the receipts.
What the business cycle is, in plain English
The business cycle is the economy’s boom and bust loop. It speeds up, it peaks, it slides into a recession, then it recovers and does it all again. One of the cleanest ways to measure it is factory activity. Every month, factory managers across the country get surveyed on whether things are picking up or slowing down, and that gives you one number for the health of the economy. Above the middle line means growing. Below it means shrinking. I used that number for all 15 years so the test is honest and not cherry-picked.
The claim we are testing is simple. It says Bitcoin booms and busts because the economy does. If that were true, the two would move together. Strong economy, strong Bitcoin. Weak economy, weak Bitcoin. That is the whole theory, and it is easy to check.
Does Bitcoin follow the business cycle? The 15-year answer
I lined up 15 years of Bitcoin next to the economy and scored how closely they move. Picture a dial where 1 means a perfect match and 0 means no link at all. It came back at basically zero. Not a weak link, not a slow one that shows up later. There was nothing there to lag.
Now look at Bitcoin’s two biggest moves and it gets worse for the theory. Its giant run from about $16,000 to about $126,000, an 8x, happened while the economy was shrinking (the shaded stretch in the chart at the top of this page). Then it topped in October 2025 with the economy still shrinking. Both of its biggest moves in 15 years went the opposite way from the economy.
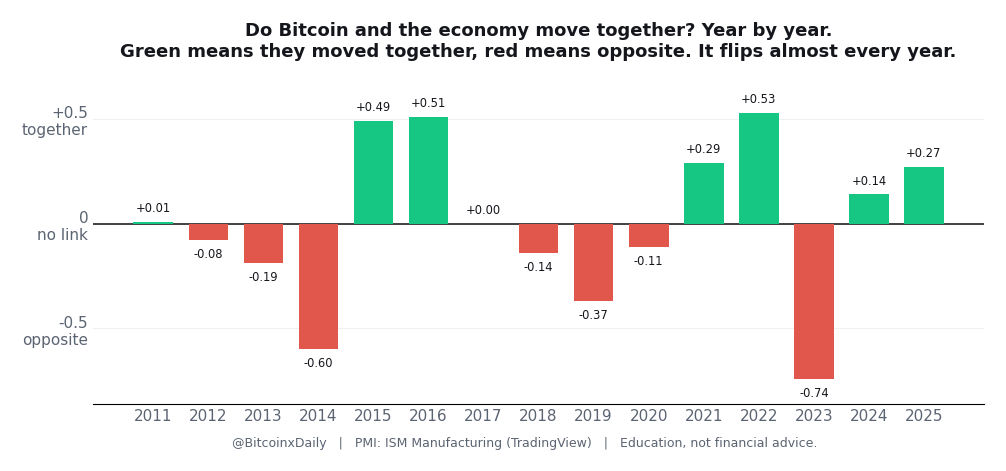
Year by year, the link is a coin toss
Zoom in and it gets even clearer. If you check how Bitcoin and the economy moved together in each single year, the answer flips almost every year. Some years they drift the same direction. Some years they go dead opposite. Out of the last 15 years, they moved opposite in 7 of them. A real driver does not flip its sign every year. Gravity does not push you down on Mondays and up on Tuesdays. A coin toss flips. And a coin toss does not forecast the weather.
Right now is the cleanest test there is
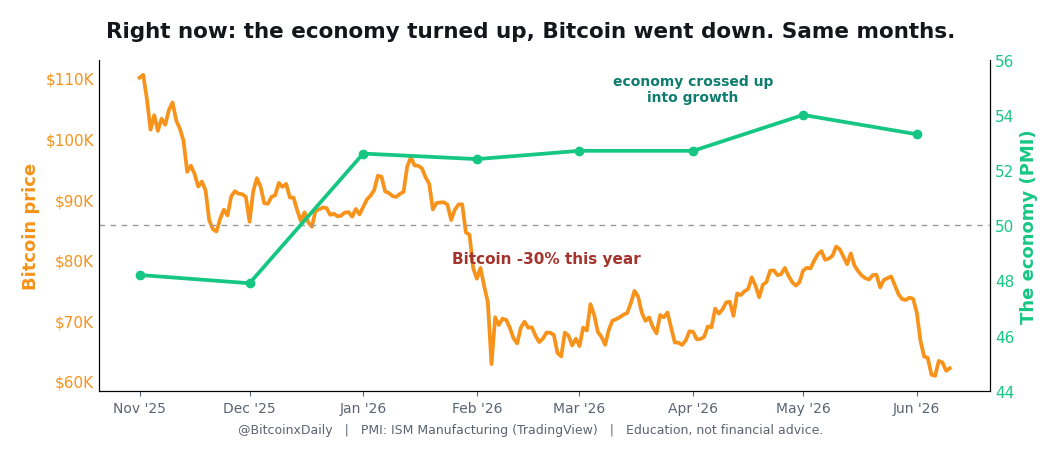
You do not even need history for this one. You can watch it live. Early this year the economy crossed up from shrinking into growing. If Bitcoin followed the economy, it should be rising right now. Instead it is down about 30% this year. The economy went green and Bitcoin went the other way, in the exact same months. The follow-the-economy theory is failing in real time.
The honest half nobody says out loud
Now let me be fair, because this is where most of the internet stops. Bitcoin does move with the market’s mood day to day, and it has done so more since 2020. On a scary day when markets are nervous, Bitcoin usually falls too. That part is real, and I am not going to pretend it is not.
But moving with the daily mood is not the same thing as being timed by the economy. A jumpy week tells you nothing about when a four-year top lands. People take the true, small thing (Bitcoin reacts to nervous days) and quietly upgrade it into the false, big thing (the economy times the whole cycle). Those are not the same claim.
So what actually lines up? The halving sets the schedule
Zoom all the way out and count what is left standing. In 15 years we got 4 full Bitcoin cycles. In that same window the United States had 1 recession, back in 2020. One recession cannot possibly time four separate tops and four separate bottoms. The math does not fit. So the business cycle is out.
The one thing that lines up with all four cycles is the halving, the moment roughly every four years when the new supply of Bitcoin gets cut in half. Look at the last three tops. The 2017 top came 525 days after its halving. The 2021 top came 546 days after. The 2025 top came 534 days after. All three landed inside about a three-week window of each other, roughly 18 months out. That is not the economy. That is a schedule the market keeps resetting on its own supply calendar.
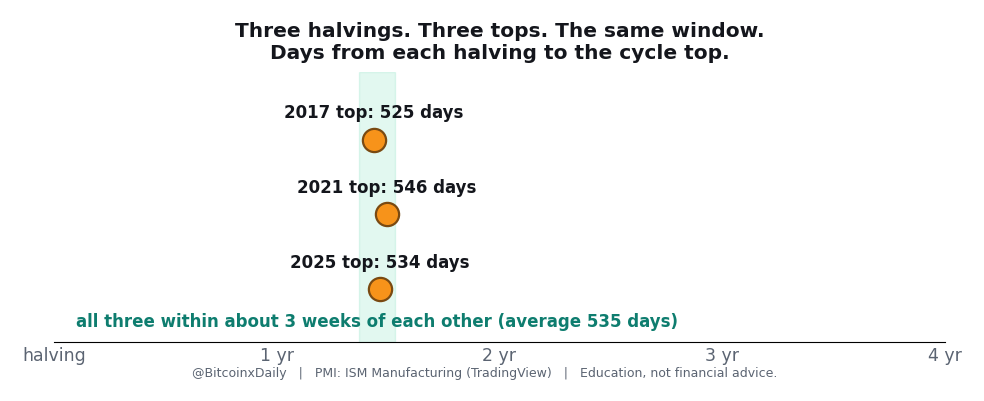
Three cycles is a small stack, and I am not promising the schedule repeats forever. But three tops within three weeks of each other beats a link that is basically zero and flips its sign every year. If you want the full picture, that is the whole point of the four-year cycle, and I stress tested it in is the four-year cycle dead.
How to spot a cherry-picked chart
This theory spreads the way every bad crypto idea spreads. A big account posts it with total confidence and zero data, a hundred smaller accounts repeat it, and nobody checks. Here is how to check any claim like it yourself, in under a minute.
- Ask for the full history. If someone only shows you 2020 to 2022, ask what the other 13 years look like. A pattern that only exists in the years they picked is not a pattern.
- Rising together is not the same as connected. Two things can both drift up over a decade and share almost nothing week to week.
- Watch for a flipping sign. If the link is positive some years and negative others, it is noise dressed up as a signal.
- Beware the claim that can never be wrong. If growth going up is bullish and growth going down is also somehow bullish, that is not a theory. It is a horoscope.
The honest cycle read, including which patterns actually hold and how to spot the fake charts, is in our free Bitcoin Cycle Field Guide, and you can watch where this cycle stands right now on the free live tracker at bitcoin-daily.com/cycle.
Common questions
Does Bitcoin follow the business cycle?
Over 15 years, no. When you measure how closely Bitcoin and the economy move, the link comes back at basically zero, and year to year it flips between moving together and moving opposite. Bitcoin's biggest run happened while the economy was shrinking, and it is falling now while the economy is growing.
Is the Bitcoin halving cycle dead?
Not by the timing. The last three cycle tops landed 525, 546, and 534 days after each halving, all within about a three-week window, roughly 18 months out. The supply cut itself is small now, but it still sets the schedule the cycle runs on. Three cycles is a small sample, so it is a pattern to respect, not a guarantee.
Why did Bitcoin go up while the economy was in a recession?
Because the economy is not what times Bitcoin's cycle. Bitcoin ran from about 16,000 to about 126,000, an 8x, while factory activity was below the line and the economy was shrinking. If the business cycle drove Bitcoin, that run could not have happened.
Does Bitcoin move with the stock market and the economy at all?
Day to day, yes, and more so since 2020. On risk-off days when markets are nervous, Bitcoin usually falls too. But reacting to the daily mood is a different thing from being timed by the economy. A jumpy week does not decide when a four-year top lands.
Keep reading
We break down the market like this every day, free on Instagram and YouTube, and in depth inside the community.
Education, not financial advice. Trading involves real risk.