What Drives Bitcoin's Price? (The 5 Forces)
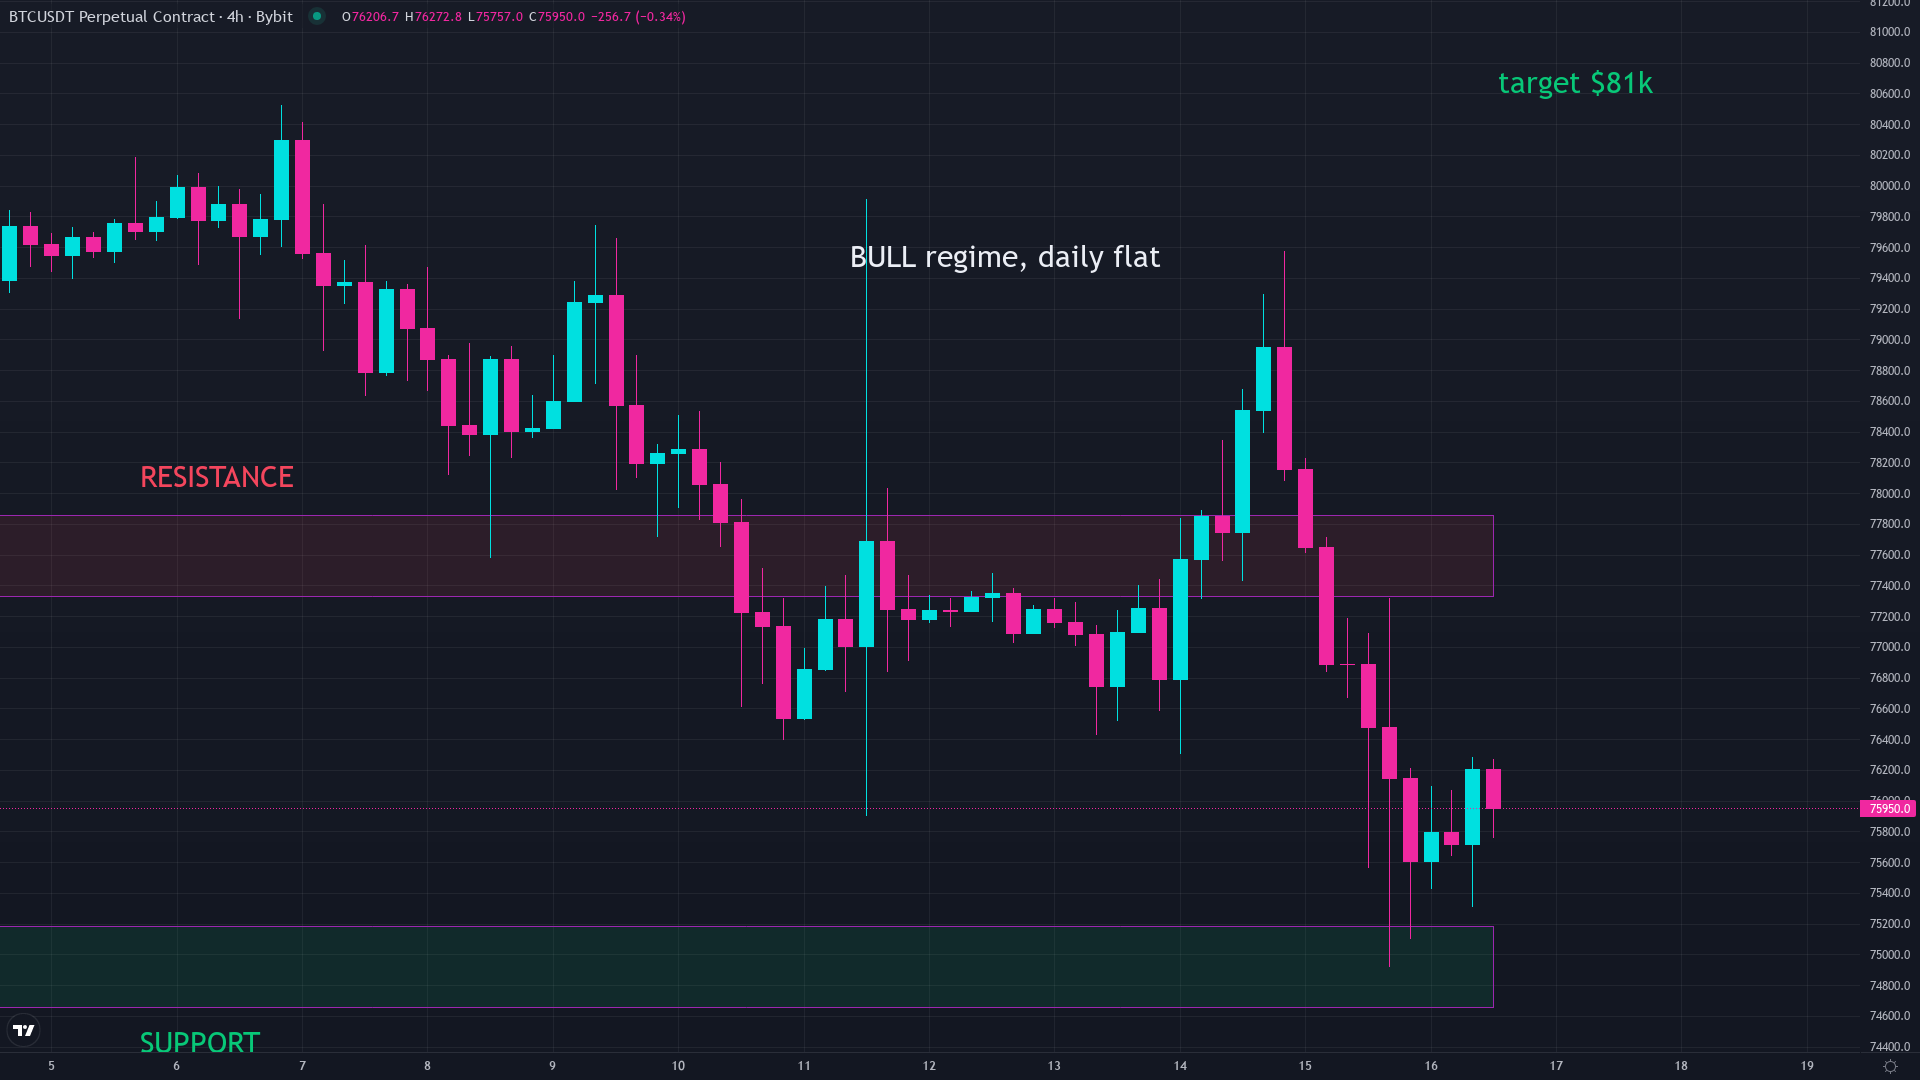
Everyone has a theory about what drives Bitcoin’s price. Some say it follows the stock market. Others say it tracks the news cycle. Most of the time, both groups are wrong. Bitcoin moves on its own logic, and once you understand the five forces behind it, the price action that looks random starts to make a lot more sense.
Force 1: Supply that only shrinks
There will only ever be 21 million Bitcoin. That number is locked into the code. Nobody can change it, no board vote, no central bank meeting, no emergency decree. As of September 2026, roughly 19.7 million have already been mined, and the rate of new coins entering the market just got cut in half again.
In April 2024, the latest Bitcoin halving slashed the mining reward from 6.25 BTC per block down to 3.125. That means miners produce about 450 new coins per day instead of 900. Every four years, the drip gets slower. Every four years, fewer new coins hit the market to be sold. When demand stays flat and supply shrinks, price goes up. When demand grows and supply shrinks, price goes up fast.
Force 2: Demand from new buyers (especially big ones)
For most of Bitcoin’s life, the buyers were individuals. Retail traders, early adopters, people willing to figure out a crypto wallet. That changed in January 2024 when the first U.S. spot Bitcoin ETFs launched. By early 2026, those ETFs held over $155 billion in assets. BlackRock’s fund alone crossed $54 billion.
That matters because ETF money comes from pension funds, hedge funds, and financial advisors who would never have opened a Coinbase account. The buyer pool got dramatically wider. When new categories of buyer show up for an asset with fixed supply, the price ceiling moves higher.
Force 3: The four-year cycle
Bitcoin has followed a roughly four-year cycle since its birth, driven by the halving schedule. The pattern looks like this: the halving happens, supply tightens, price climbs over 12 to 18 months, the market overheats, then it crashes and spends a year or two recovering before the next halving resets the cycle.
After the 2020 halving, Bitcoin climbed 527% in the following 12 months. After the 2016 halving, the gain was even bigger. The cycles are not identical, the peaks get smaller in percentage terms each time, but the rhythm has repeated for four consecutive cycles. That is not proof it will repeat a fifth time. But it is a pattern backed by more data than almost anything else in crypto.
You can track where we are in the current cycle on our live halving countdown chart.
Force 4: Global money and interest rates
Bitcoin does not track the economy the way stocks do. It has gone through entire bull runs while the global economy was shrinking. But it does respond to liquidity, how much money is sloshing around the financial system looking for a home.
When central banks print money and rates are low, risk assets tend to rise. Bitcoin, as the riskiest major asset, tends to rise the most. When rates spike and money gets tight, Bitcoin tends to fall first and hardest. The connection is loose, not mechanical. But if you ignore what central banks are doing, you will be surprised by moves that everyone else saw coming.
Force 5: Sentiment and leverage
The first four forces set the direction. Sentiment and leverage decide how far the move goes before it snaps back. When the Fear and Greed Index hits extreme greed, traders pile into leveraged bets, and a small pullback can trigger a cascade of forced selling that turns a 5% dip into a 20% crash. When it hits extreme fear, the opposite happens: sellers are exhausted, and the slightest good news can launch a violent bounce.
Today, the index reads 51, dead neutral. That tells you the crowd is not leaning hard in either direction. The emotional extremes are where the biggest moves start, and right now, Bitcoin is in the calm before one of them.
Why most people get it wrong
The mistake almost everyone makes is watching only one of these forces. Stare at the news and you think Bitcoin moves on headlines. Stare at the halving and you think the cycle is automatic.
None of them work alone. Bitcoin’s price is what happens when shrinking supply meets shifting demand inside a four-year rhythm, amplified by global money flows and human emotion. The people who sold every crash in Bitcoin’s history sold to someone. Those buyers understood the forces. The sellers only watched the price.
Common questions
What is the biggest driver of Bitcoin’s price?
Supply. The 21-million cap and the halving schedule create a predictable squeeze that no other major asset has. Demand can shift, but supply only moves in one direction: down.
Does Bitcoin follow the stock market?
Sometimes, briefly. Over any multi-year window, the link is weak. Bitcoin has run full bull markets while stocks were flat, and crashed while stocks rallied. They occasionally move together during liquidity shocks, but treating them as joined is a mistake.
How does the Bitcoin halving affect price?
The halving cuts the rate of new supply in half, roughly every four years. Historically, the 12 to 18 months after each halving have produced the strongest gains. The April 2024 halving cut the block reward from 6.25 to 3.125 BTC per block.
Why does Bitcoin crash so hard?
Leverage. When traders borrow money to bet on Bitcoin and the price dips, their positions get forcibly closed, which pushes the price lower, which triggers more forced closures. The crashes are amplified by the same tool people use to chase the rallies.
Is Bitcoin affected by inflation?
Indirectly. High inflation leads to higher interest rates, which tightens the money supply, which tends to hurt Bitcoin in the short run. But over a longer horizon, Bitcoin with its fixed supply has been one of the best-performing assets during periods of currency devaluation.
Common questions
What is the biggest driver of Bitcoin's price?
Supply. The 21-million cap and the halving schedule create a predictable squeeze that no other major asset has. Demand can shift, but supply only moves in one direction: down.
Does Bitcoin follow the stock market?
Sometimes, briefly. Over any multi-year window, the link is weak. Bitcoin has run full bull markets while stocks were flat, and crashed while stocks rallied.
How does the Bitcoin halving affect price?
The halving cuts the rate of new supply in half, roughly every four years. Historically, the 12 to 18 months after each halving have produced the strongest gains.
Why does Bitcoin crash so hard?
Leverage. When traders borrow money to bet on Bitcoin and the price dips, their positions get forcibly closed, which pushes the price lower, triggering more forced closures.
Is Bitcoin affected by inflation?
Indirectly. High inflation leads to higher interest rates, which tightens the money supply, which tends to hurt Bitcoin in the short run. But over a longer horizon, Bitcoin has been one of the best-performing assets during periods of currency devaluation.
Keep reading
We break down the market like this every day, free on Instagram and YouTube, and in depth inside the community.
Education, not financial advice. Trading involves real risk.