What Is a Liquidity Sweep in Crypto? (And How to Avoid Being the Exit)
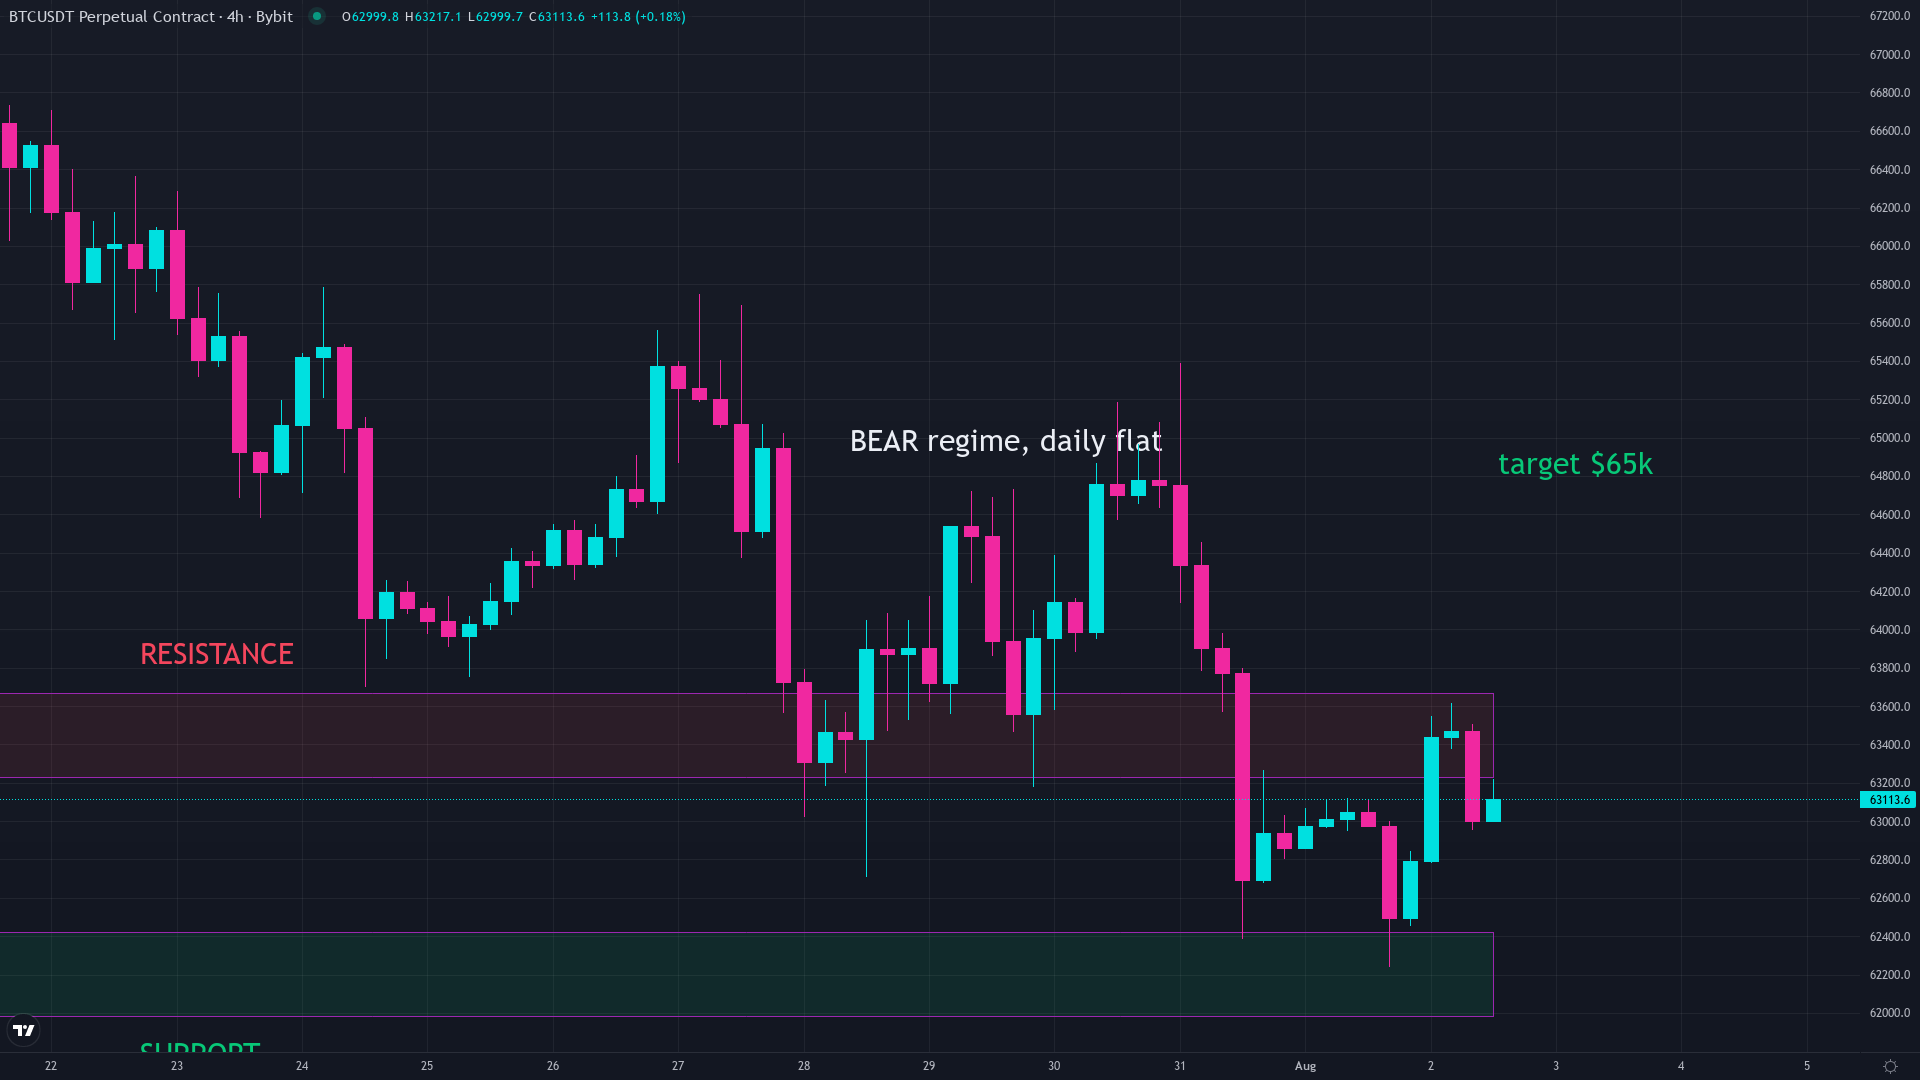
You bought at a support level. You placed your stop just below it, right where it made sense. The price dipped below that level for a few minutes, hit your stop, kicked you out, then reversed and ran higher.
This is not bad luck. It is a liquidity sweep, and once you understand what it is, you will never see a sudden spike-and-reverse the same way again.
What a liquidity sweep is in crypto
A liquidity sweep in crypto is when the price moves sharply past a key level, triggering a cluster of stop-loss orders sitting there, then immediately reverses direction. The move leaves behind a long wick on the candle. The price looked like it was breaking down. It was not. It was collecting orders.
Here is why this happens. When thousands of traders all look at the same chart, they all see the same support levels. They all set their stops just below those levels. That creates a large cluster of sell orders sitting at nearly identical prices. A big enough price move can hit all of those stops at once, filling a huge volume of orders in one quick sweep before reversing.
Stop-loss orders are sell orders. When they trigger, they add selling pressure. A liquidity sweep uses that selling pressure as the fuel for a fast move, then reverses once the orders have been filled.
Why obvious support levels get swept more than others
The more obvious a support level is on a chart, the more stops are clustered just below it. Round numbers like $60,000 or $65,000. The low of the previous week. A price level that held three times in a row. These are the levels that appear on every chart.
When a price level is that obvious, it becomes a magnet. Every trader who is long has their stop below it. Every trader who missed the entry wants to buy the dip there. All of those orders sitting at the same price create a target. A quick sweep through that level collects all of them.
This is not a conspiracy. It is just math. Stops concentrate at obvious levels because obvious levels are where people put them. The sweep is the natural result of price moving through a dense cluster of orders.
What a liquidity sweep looks like on the chart
A liquidity sweep almost always leaves a long lower wick. The candle opens, dips sharply below a key level, triggers the stops sitting there, then closes back above that level. On a 15-minute chart it can look terrifying. On the daily chart it barely registers.
The three clearest signs that a sweep just happened:
- A clear, well-known support level that has held multiple times and that most traders are watching.
- A fast spike below that level followed by an immediate recovery. The price does not stay below it.
- A volume spike during the wick that drops off as the price climbs back above the level.
If all three show up together, there is a good chance you just watched a sweep, not a real breakdown.
How to stop being the exit
The simplest fix is to stop placing your stop at the obvious level. Put it past the obvious level, far enough to survive a normal wick. If most traders are placing stops at $62,000, a stop at $61,500 costs a little more risk per trade but keeps you in when the inevitable wick fires.
The second fix is to wait for a candle to close before deciding a level has broken. A wick below support that closes back above it is almost never a real breakdown. A full candle body that closes below the level is a different situation. One is a sweep. The other is a trend change. Learn which is which before you act.
The third fix is to size smaller so you can afford wider stops. If you keep your risk at 1% per trade, a wider stop does not change your dollar loss. It only changes how many coins you hold. The math stays the same. The survival rate goes up.
In 109 live trades, the biggest difference between a bad stop placement and a good one was not where the market went. It was whether my stop was at the obvious place or just past it. Most of the losing trades I have reviewed were stopped out on a wick before the real move. The entry was right. The stop placement was predictable.
One of the most common crypto trading mistakes is placing a stop right at the obvious level instead of past it. Fixed, that one habit single-handedly improves how many trades finish without getting stopped out early on a wick.
Understanding a liquidity sweep does not mean you will catch every reversal. It means you will stop getting surprised by the ones that were always going to happen. Once you know where the orders are clustered, you start placing your stops in less crowded places and waiting for the market to show its hand before you act.
Common questions
What is a liquidity sweep in crypto?
A liquidity sweep is when the price moves sharply past a key level, triggering clustered stop-loss orders sitting there, then immediately reverses direction. The move collects those orders before going the other way.
How do you spot a liquidity sweep?
Look for a long lower wick that dips below a well-known support level and then closes back above it, often with a volume spike during the wick. If the price does not stay below the level, it was likely a sweep.
Is a liquidity sweep the same as a stop hunt?
They describe the same move from different angles. A stop hunt focuses on whose orders got triggered. A liquidity sweep focuses on the pool of orders being collected before the reversal.
How do I avoid getting swept out of my trades?
Place your stop past the obvious level rather than at it, and wait for a candle to close before deciding a support has broken. A wick below support that closes back above it is rarely a real breakdown.
What causes liquidity sweeps in crypto?
Obvious support and resistance levels attract clusters of stop-loss orders from many traders. When enough sell orders stack at one price, a fast move through that level can trigger them all at once before reversing.
Keep reading
We break down the market like this every day, free on Instagram and YouTube, and in depth inside the community.
Education, not financial advice. Trading involves real risk.