Why Does Bitcoin Crash? Every Crash, Exposed
Every Bitcoin crash has looked like the end. Every one so far has ended the same way. If you are watching the price fall right now and wondering why does Bitcoin crash, you are asking the right question at exactly the right time. Because the answer is not random. It is a pattern, and it has repeated six times in a row.
Why does Bitcoin crash? The short answer
Bitcoin crashes because it runs in cycles, and every cycle overshoots on the way up and then corrects hard on the way down. The gains attract money, the money attracts leverage, the leverage creates fragility, and eventually something breaks. The trigger changes every time. The structure underneath does not.
In 2011, it was a hack. In 2014, it was an exchange collapse. In 2018, it was a speculative bubble popping. In 2020, it was a global pandemic. In 2022, it was a lending blowup. In 2025, it was tariffs, rate fears, and leveraged positions unwinding. Six different headlines. One identical shape.
The crash record, in plain numbers
Here is every crash that took Bitcoin down 50% or more from its previous high.
- 2011. From $32 to $2. A 94% drop in five months.
- 2013 to 2015. From $1,163 to $152. An 87% drop over 14 months.
- 2017 to 2018. From $19,783 to $3,122. An 84% drop over 12 months.
- 2020. From $10,500 to $3,850 in two days. A 63% crash in the span of 48 hours, driven by a global panic.
- 2021 to 2022. From $69,000 to $15,479. A 77% drop over 12 months.
- 2025 to 2026. From $126,272 to $57,735 so far. A 54% drop, now 329 days from the top.
The average peak-to-trough crash across these six events is roughly 77%. The median time from top to bottom is about 12 months. And every single one recovered to set a new all-time high.
The pattern nobody talks about
Crashes get smaller over time. The first one was 94%. Then 87%. Then 84%. Then 77%. This cycle so far is 54%. That is not a coincidence. As Bitcoin gets bigger, the swings compress. More holders, more liquidity, and more institutional money all act as shock absorbers that did not exist in 2011.
There is a second pattern hiding inside the data. Every crash has lasted roughly 12 to 14 months from the top to the lowest price. The 2020 crash was shorter because it was driven by an external shock, not an internal cycle. Strip that one out and the timing is remarkably consistent.
What actually triggers a Bitcoin crash
The headlines change. The mechanics do not. Here is the recipe that has started every major crash.
- Leverage builds up. Traders borrow money to bet on higher prices. That leverage magnifies gains on the way up and losses on the way down.
- A catalyst hits. It could be a rate hike, a hack, a regulatory scare, or a single large seller. The specific event does not matter nearly as much as the fragility underneath.
- Forced selling begins. Leveraged positions get liquidated, which pushes the price lower, which triggers more liquidations. This loop is why crypto crashes feel so fast and so violent.
- Fear takes over. Retail traders panic-sell at the worst possible time. The Fear and Greed Index hits single digits. Social media declares Bitcoin dead.
That sequence has played out in 2014, 2018, 2022, and again in 2026. The January tariff shock alone forced more than $1.4 billion in liquidations in a single day.
Why Bitcoin always recovers
Every crash so far has ended with a new all-time high. Not because of hope, but because of supply. Bitcoin has a hard cap of 21 million coins. Every four years the halving cuts the number of new coins created in half. The last halving happened in April 2024, cutting the new supply from 6.25 to 3.125 coins per block.
That means the supply shrinks on a fixed schedule. If demand even stays flat, the math tips toward higher prices over longer horizons. And historically, demand has not stayed flat. It has grown cycle after cycle.
None of this means the next crash cannot go deeper, or last longer, or break the pattern for the first time. It means the pattern exists, it has held six times, and the structural reasons behind it have not changed.
Where we are right now
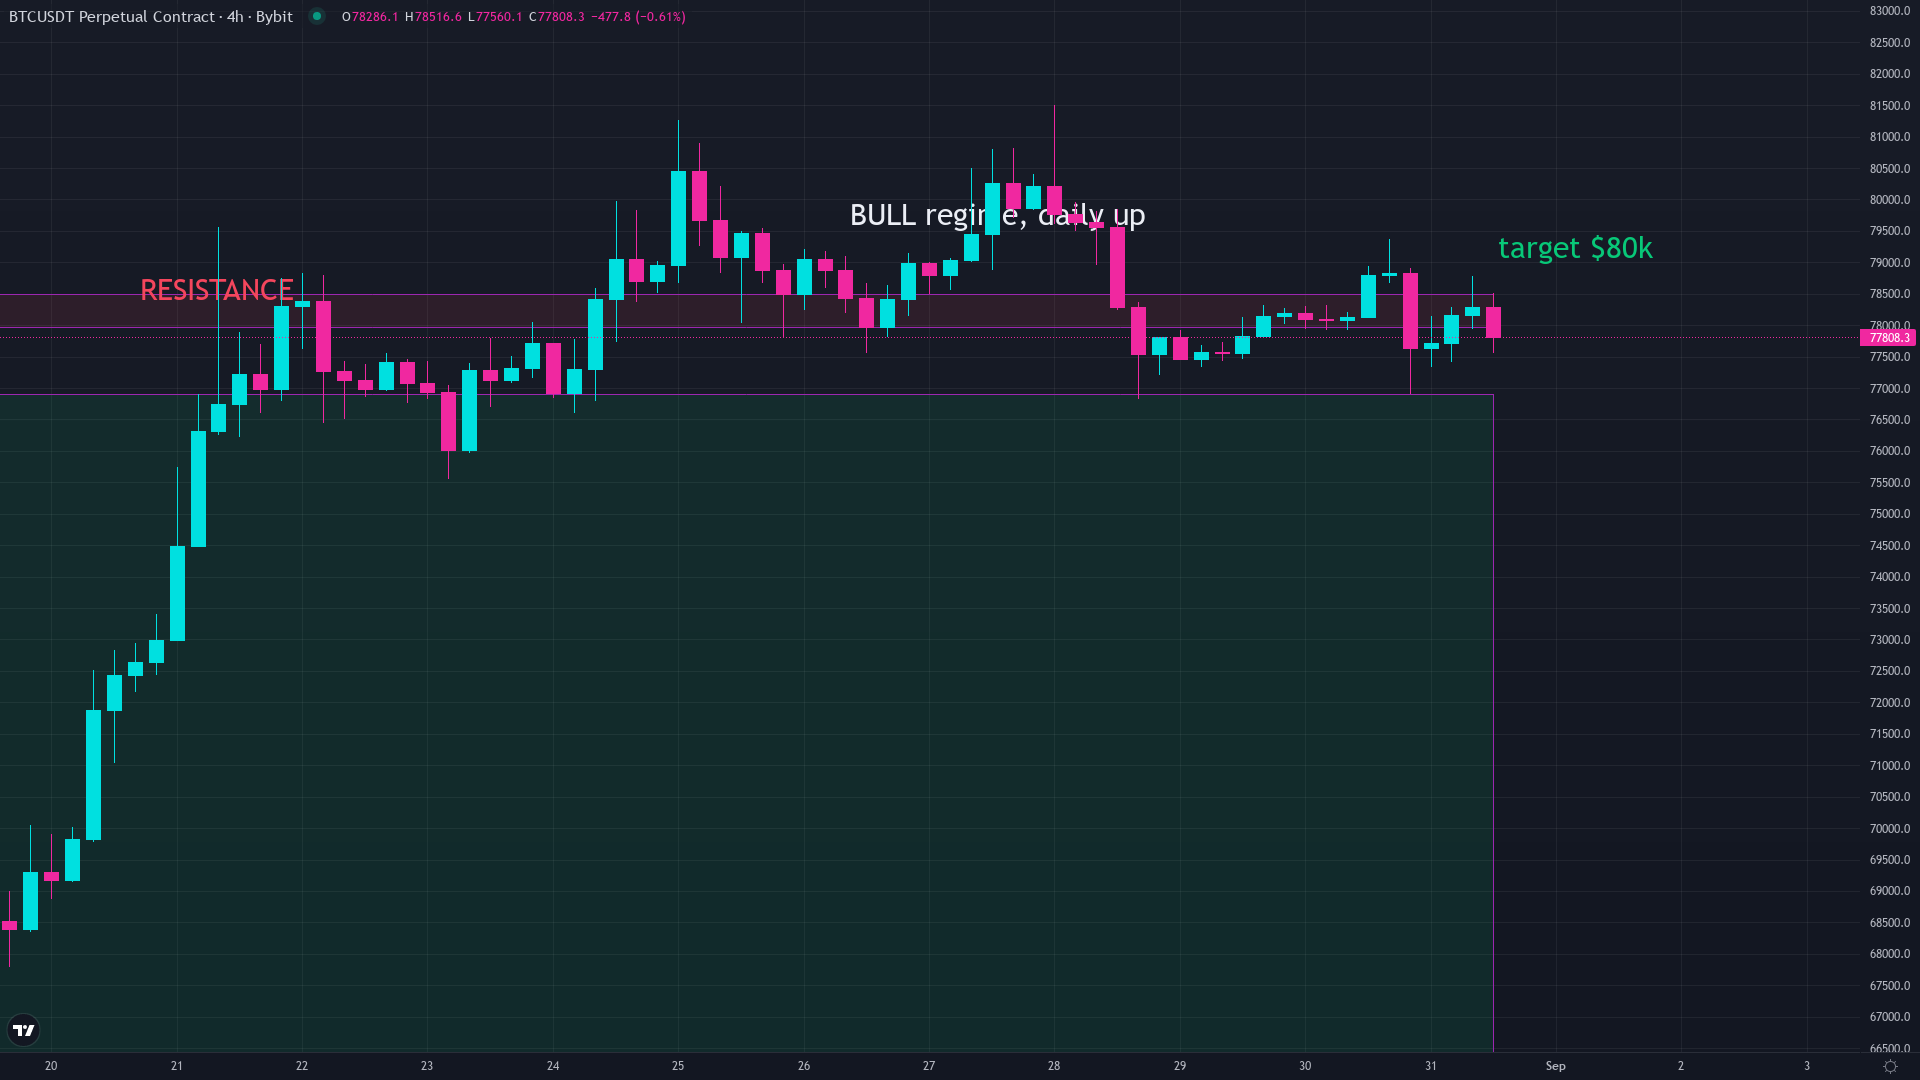
Bitcoin is trading around $78,000, roughly 38% below the October 2025 high of $126,272. The Fear and Greed Index sits at 62, which is well above the extreme fear zone that has historically marked bottoms. The daily trend is up, but the shorter timeframes are turning down.
If the pattern from previous cycles holds, the bottom window for this bear market falls somewhere in the next few months. But timing a bottom is a different problem than understanding why crashes happen. Knowing the why is what keeps you from selling at the worst possible moment.
Every crash looks like the end while you are living through it. So far, every one of them has turned out to be a chapter, not the final page. The question is whether you have the stomach to wait for the next chapter to start. For a deeper look at how every past crash compares to this one, side by side, check our full crash history breakdown.
Common questions
Why does Bitcoin crash so much?
Bitcoin crashes because it runs in boom-and-bust cycles driven by leverage and speculation. Every cycle overshoots on the way up, builds fragile leveraged positions, and then corrects sharply when a catalyst hits.
How many times has Bitcoin crashed more than 50%?
Bitcoin has crashed more than 50% from its all-time high six times since 2011. The average crash is roughly 77%, and every one has been followed by a recovery to a new record high.
Does Bitcoin always recover after a crash?
So far, yes. All six major crashes have ended with Bitcoin setting a new all-time high. The fixed supply cap and growing demand have driven recovery every time, though past performance does not guarantee future results.
How long do Bitcoin crashes last?
The typical Bitcoin crash lasts 12 to 14 months from the peak to the lowest price. The current crash from the October 2025 high is 329 days old as of August 31, 2026.
What triggers a Bitcoin crash?
The trigger changes every cycle. Hacks, regulatory scares, rate hikes, and pandemic panics have all started crashes. The common thread is excessive leverage that turns a catalyst into a cascade of forced selling.
Keep reading
We break down the market like this every day, free on Instagram and YouTube, and in depth inside the community.
Education, not financial advice. Trading involves real risk.