The AHR999 Index, Explained (a DCA Buy Gauge for Bitcoin)
Most Bitcoin charts show you what price is doing. The AHR999 index shows you whether that price is cheap or expensive relative to two different cost benchmarks at once. When both say cheap at the same time, the index has appeared at or near every major Bitcoin bottom on record.
What the AHR999 index actually measures
The index was created by a Chinese crypto blogger who goes by the handle “ahr999” on Weibo. The goal was practical: give dollar-cost averaging investors a simple, objective signal for when to buy more aggressively and when to ease back. No complicated charts, no opinions. Just two numbers.
The formula multiplies two ratios together:
- Your entry vs the recent crowd. It takes Bitcoin’s current price and divides it by the average price over the past two hundred days. If Bitcoin is trading below what most buyers paid over that period, this part of the calculation drops below 1. You are buying cheaper than the recent crowd paid.
- Your entry vs where price should be over time. It divides the current price by a long-run price estimate built from Bitcoin’s full history since 2010. This estimate tracks how the price has grown as the asset has aged. When price is far below this long-run trend, this part of the calculation also drops below 1.
Multiply those two together and you get the AHR999 number. When both say Bitcoin is cheap at the same time, the number falls well below 1. When price is stretched above both benchmarks, the number climbs.
The three AHR999 zones
The creator defined three zones based on where the index has landed across Bitcoin’s history:
- Below 0.45: the bottom zone. The rarest reading. Bitcoin has spent only about 8.5% of its entire history at this level. Every time the index has dropped here, it has preceded a major recovery. In early July 2026, with Bitcoin near $63,000, the index hit 0.32, the lowest reading in years.
- 0.45 to 1.2: the DCA zone. Bitcoin is not screaming cheap, but both benchmarks still point below fair value. This is the range where buying a fixed amount on a regular schedule, without trying to pick the exact bottom, has historically made sense. Most of the accumulation that fed into the next bull market happened inside this band.
- Above 1.2: the caution zone. Both measures are elevated. Bitcoin is trading above its recent average AND above where the long-run trend says it should be. The index does not call for selling, but it says this is not the moment to buy more aggressively.
What the history actually shows
The times the AHR999 index has dropped below 0.45 line up with the deepest moments of every Bitcoin bear market. The December 2018 bottom near $3,200. The March 2020 crash below $4,000. The summer 2022 drop below $20,000. Each of those felt like a different kind of permanent end. Each of those also had the AHR999 index flashing the same signal: price well below both of its cost benchmarks.
Readings below 0.45 are not a guarantee. The index can stay in the bottom zone for weeks or months before anything changes. In late 2018, it sat there through most of the winter. What the record shows is that buying when both benchmarks agree Bitcoin is cheap has been, over time, a far better approach than buying when the index is elevated. You can see the live reading at the live AHR999 chart.
What the AHR999 index is saying right now
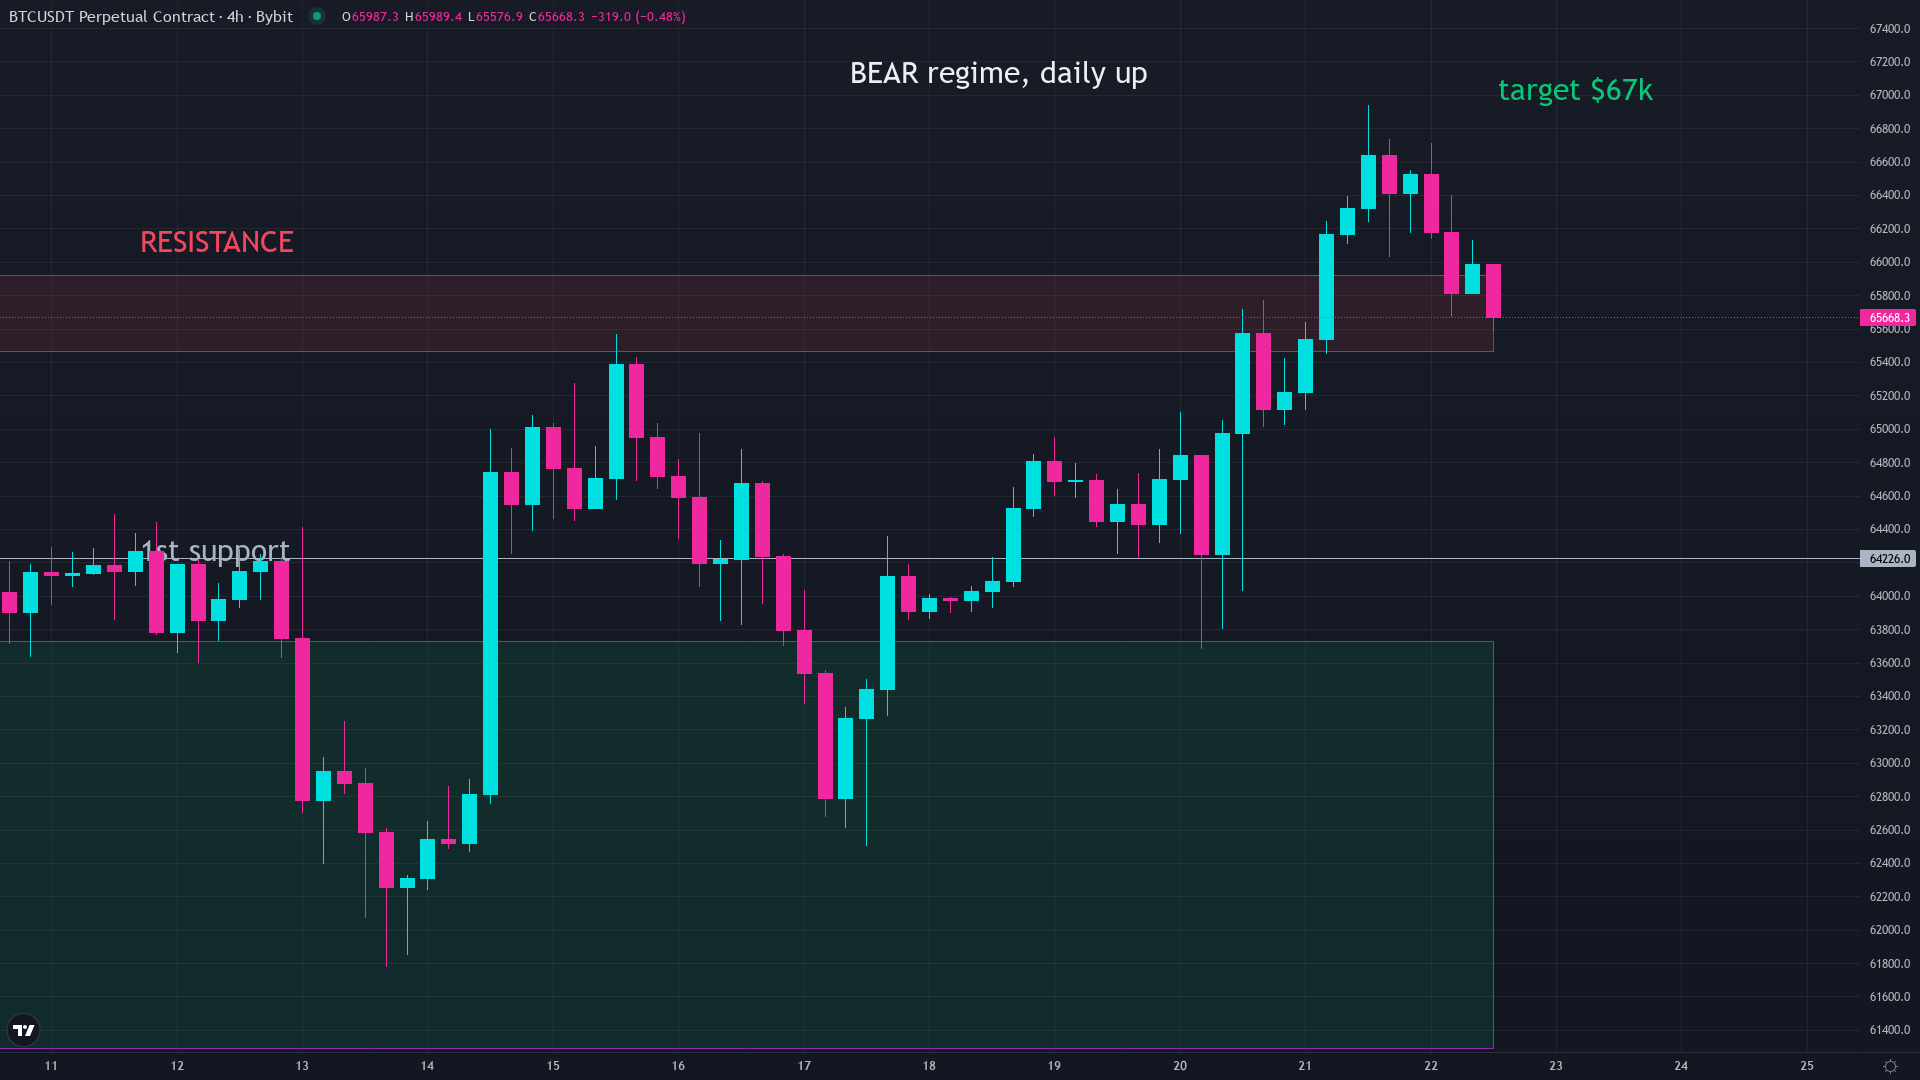
In early July 2026, the AHR999 index dropped to 0.32 while Bitcoin was near $63,000. That put it deep inside the bottom zone, the same territory that has historically marked the most aggressive accumulation points. By late July 2026, with Bitcoin recovering to around $65,500, the index is climbing back toward the DCA zone but remains historically low. Both of its inputs still point the same direction: price is below the average of the past two hundred days and below the long-run price estimate for an asset at Bitcoin’s age.
What the AHR999 index does not tell you
No single tool tells you when a recovery starts or how far it runs. The AHR999 index tells you where price sits relative to two objective cost benchmarks. That is useful, but it is one piece of the picture, not the whole thing.
Combining it with other on-chain signals gives a more complete read. The MVRV ratio approaches the same question from a different angle, comparing the total market value to the total cost paid by every current holder. The NUPL indicator tracks how much of the market is sitting at a profit versus a loss right now. When these tools cluster together in distressed territory at the same time, the case for accumulation gets stronger than any single tool can make it alone.
Common questions
What is the AHR999 index?
A Bitcoin valuation tool created by a crypto blogger known as ahr999 that combines two cost benchmarks, the recent average price and a long-run age-based estimate, to judge whether Bitcoin is cheap, fairly priced, or expensive.
What does an AHR999 reading below 0.45 mean?
It means Bitcoin is trading well below both its recent average price and its long-run estimated value. This rare zone has appeared at or near every major Bitcoin bottom on record and has been present only about 8.5% of the time in history.
What is the AHR999 DCA zone?
A reading between 0.45 and 1.2, where Bitcoin is not at an extreme bottom but both measures still point below fair value. Most of the best long-term accumulation in past cycles happened inside this band.
How is the AHR999 index calculated?
It multiplies two ratios: current price divided by the average price over the past two hundred days, and current price divided by a long-run price estimate built from Bitcoin’s full history since 2010. The result tells you how cheap or expensive price is versus both benchmarks at once.
Where can I see the live AHR999 index?
You can track the live reading at the AHR999 chart page on this site, updated with the current Bitcoin price.
Keep reading
We break down the market like this every day, free on Instagram and YouTube, and in depth inside the community.
Education, not financial advice. Trading involves real risk.