Bitcoin Bull Market vs Bear Market: How to Tell the Difference
People love to argue about whether Bitcoin is in a bull market or a bear market. But the debate usually misses the point. A bitcoin bull market vs bear market is not about how you feel. It is about where price sits relative to its own history, and Bitcoin has repeated the same pattern four times in a row.
Once you see the pattern, the argument stops. You stop guessing and start measuring.
What makes a Bitcoin bull market
A Bitcoin bull market is simple. Price is rising from a cycle low toward a new all-time high, and it keeps going. Volume picks up. New buyers show up. Headlines turn from obituaries to FOMO.
But the part most people miss is how long it lasts. Bitcoin bull markets are not random. They have run on a roughly four-year cycle tied to the halving, the event that cuts new Bitcoin supply in half. Each bull market has started roughly 12 to 18 months after a halving and peaked about 18 months after that.
- 2012 halving. Bull market peaked in November 2013 near $1,200.
- 2016 halving. Bull market peaked in December 2017 near $20,000.
- 2020 halving. Bull market peaked in November 2021 near $69,000.
- 2024 halving. Bull market peaked in October 2025 near $126,000.
Four cycles. Four peaks. All roughly 12 to 18 months after the halving. The highs kept getting higher, and the timing barely changed.
What makes a Bitcoin bear market
A Bitcoin bear market is the other side of the coin. Price falls from the cycle peak, usually losing 50% or more, and stays down for roughly a year. Sentiment turns ugly. Trading volume dries up. People who bought near the top wonder if it is ever coming back.
Here is how every bear has played out so far.
- 2013 to 2015. Peak near $1,200. Bottom near $170. Down about 86%. Lasted about 411 days.
- 2017 to 2018. Peak near $20,000. Bottom near $3,200. Down about 84%. Lasted about 363 days.
- 2021 to 2022. Peak near $69,000. Bottom near $15,500. Down about 77%. Lasted about 376 days.
Three things jump out. First, every bear market lasted between 363 and 411 days. Second, the crashes are getting shallower each time (you can see the full breakdown in our piece on how deep Bitcoin bear markets go). Third, every single one ended. Not one lasted forever.
How to tell which phase Bitcoin is in right now
You do not need a fancy model. You need two things: where price peaked and how long ago that was.
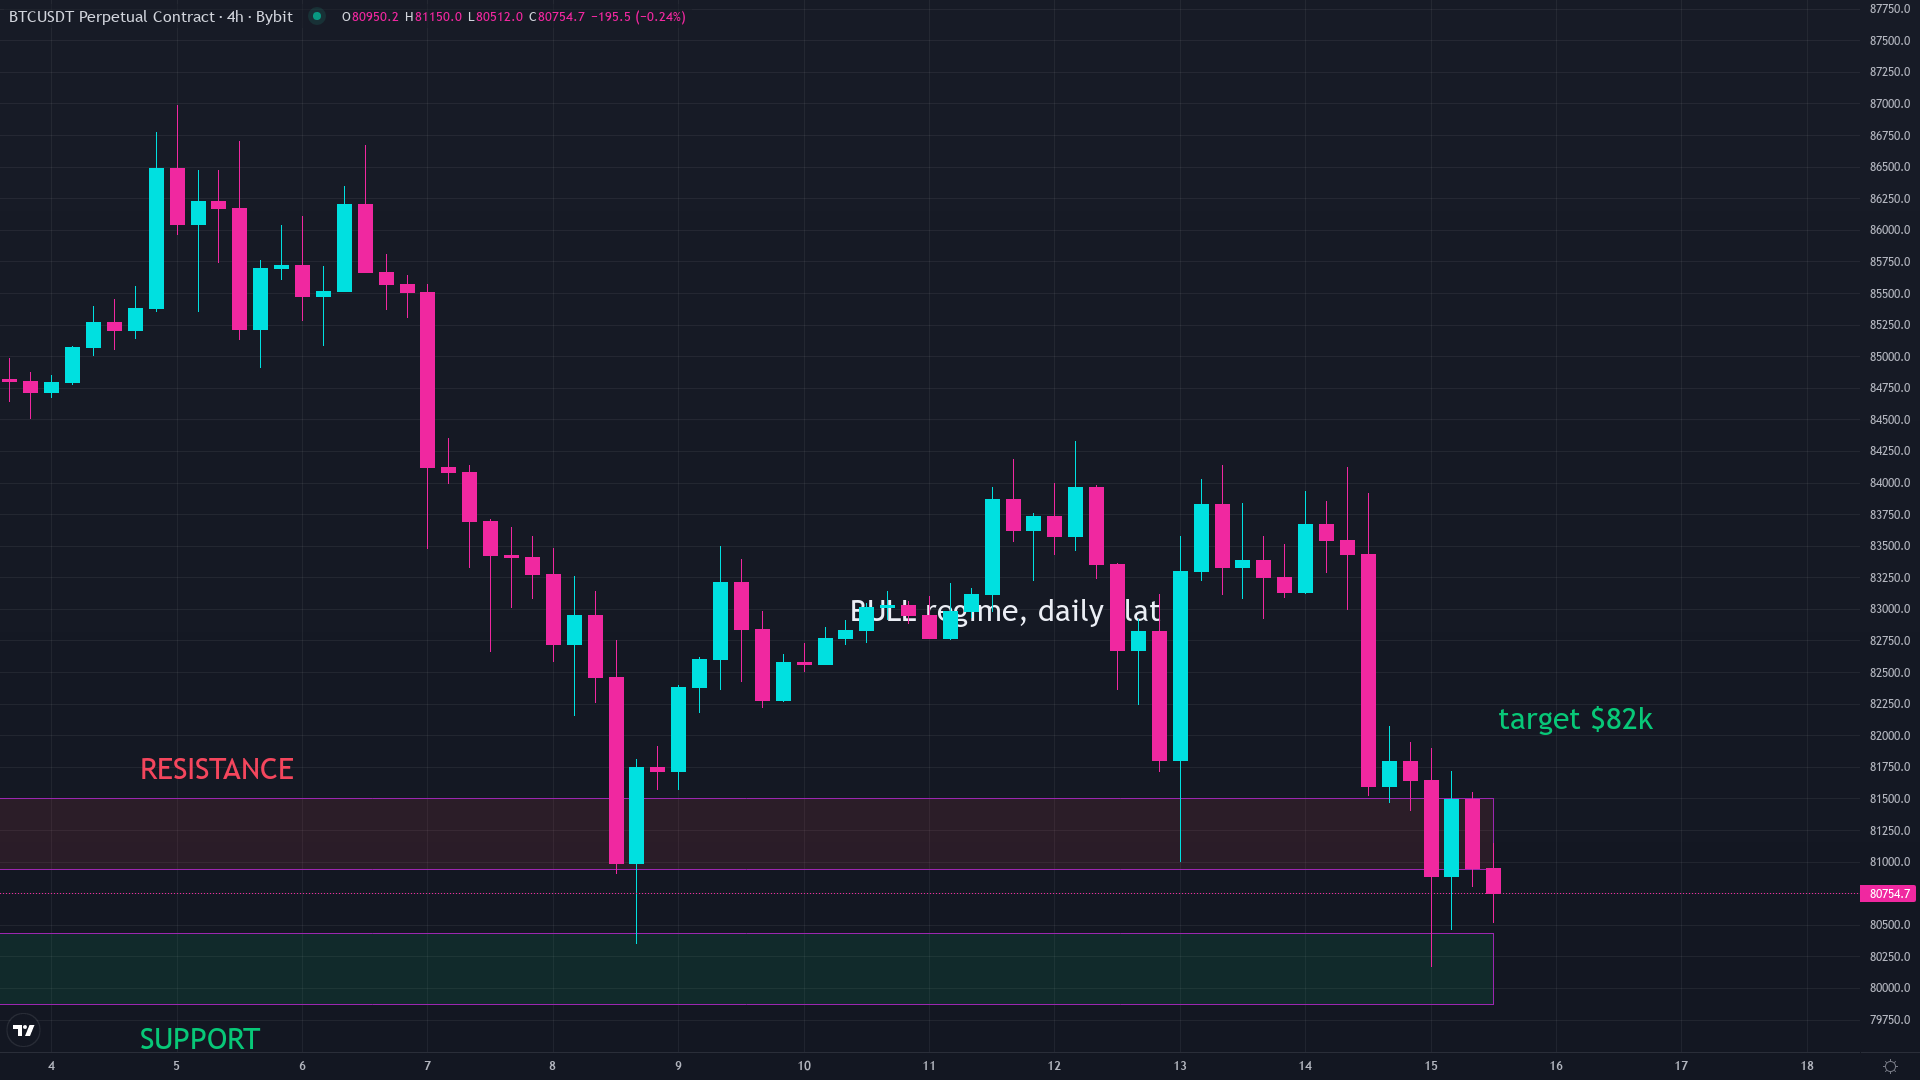
Bitcoin hit its most recent all-time high of about $126,000 on October 6, 2025. Today, October 15, 2026, is day 374 since that peak. The price sits near $80,400, down about 36% from the top.
By every historical measure, this is a bear market. Price is well below its peak. The decline has lasted nearly a year. Sentiment is neutral to fearful. That is textbook.
But here is the part that matters. The average bear market lasts about 383 days. We are at day 374. The shortest previous bear bottomed at day 363. We already passed that mark. The longest ran 411 days, which would put the outer edge at mid-November.
That does not guarantee the bottom is in. It means the historical window where bottoms happen is open right now.
The mistake most people make at the transition
The hardest moment in the cycle is not the crash. It is the turn. When a bear market ends and a bull market begins, it does not feel like a beginning. It feels like more pain. The price stops falling but nobody believes it. Volume is low. Confidence is gone.
Every bull market in Bitcoin history started when most people had given up. The bottom in January 2015 came after months of sideways grind that bored everyone out. The bottom in December 2018 came right after the final flush that convinced the last holders to sell. The bottom in November 2022 came during the FTX collapse, when people were calling Bitcoin dead for the 400th time.
The pattern is not complicated. Bear markets end when the last sellers are exhausted. Bull markets start before anyone notices.
If you want to see where Bitcoin sits relative to every historical bottom signal, the live crash chart tracks the current cycle against all previous ones, updated daily.
Common questions
How long does a Bitcoin bull market last?
Bitcoin bull markets have historically lasted about 12 to 18 months after the halving event, peaking roughly 18 months after the run begins. The exact duration varies, but the four-year cycle has repeated four times.
How long does a Bitcoin bear market last?
Bitcoin bear markets have lasted between 363 and 411 days, with an average of about 383 days. That is roughly 12 to 13 months from the all-time high to the bottom.
How do you know if Bitcoin is in a bear market?
If Bitcoin has fallen more than 20% from its most recent all-time high and stayed down for months, it is in a bear market. The current cycle peaked near $126,000 in October 2025, and price is down about 36% as of October 2026.
Is Bitcoin in a bull market or bear market right now?
As of October 2026, Bitcoin is in a bear market. It is day 374 since the all-time high, with price sitting near $80,400. History says every past bear ended between day 363 and day 411.
Do Bitcoin bear markets always end?
So far, yes. Every Bitcoin bear market in history has ended and been followed by a new bull run that set a higher all-time high than the previous one.
Keep reading
We break down the market like this every day, free on Instagram and YouTube, and in depth inside the community.
Education, not financial advice. Trading involves real risk.