Does Bitcoin Follow the Economy? (Bitcoin vs the PMI)
The theory sounds smart. A strong economy means higher consumer spending, more investment, more risk appetite. More risk appetite means more Bitcoin. So if you can track the economy, you can track Bitcoin. The Purchasing Managers’ Index, or PMI, is one of the cleanest economy gauges we have, a single monthly number that says whether factories across the country are growing or shrinking. Above 50 means growing. Below 50 means shrinking. Simple.
So I put the PMI next to Bitcoin for 15 years and measured whether they actually move together. The answer is no. Not a weak link, not a lagging one. There was almost nothing there.
What the PMI actually measures
Every month, supply managers at manufacturing companies get asked a set of questions. Are you getting more new orders than last month? Is your production up or down? Are you hiring? Their answers get averaged into one number, the ISM Manufacturing PMI. It has been tracking the health of the US economy since 1948. Above 50 means the factory side of the economy is expanding. Below 50 means it is contracting. It is one of the first hard data points released each month, which is why traders and economists watch it so closely.
The PMI does not measure prices. It does not measure inflation or interest rates directly. It measures activity. Are real people ordering more stuff and making more things? That is why it is considered a leading signal for the broader economy. When the PMI drops below 50 for several months in a row, a recession is usually not far behind.
Does Bitcoin follow the PMI?
The short answer is no, and the data is not even close. When you score how closely Bitcoin’s monthly price moves line up with monthly PMI readings over the last 15 years, the number comes back near zero. Not a weak link. Not a slow one that kicks in after a delay. The two just do not track each other in any reliable way.
You can see exactly where Bitcoin and the PMI stand against each other right now on the live Bitcoin vs PMI chart. What you find is not the tidy link people imagine.
Here is the most striking test. Bitcoin’s biggest run in its entire history started in January 2023 near $16,000 and ended in October 2025 at $126,200. That is roughly an 8x move. For most of that run, the PMI was below 50. The economy was technically contracting. Factories were shrinking. If the theory were right, Bitcoin should not have been able to run at all during those years. Instead it went 8x.
The current picture makes it even clearer
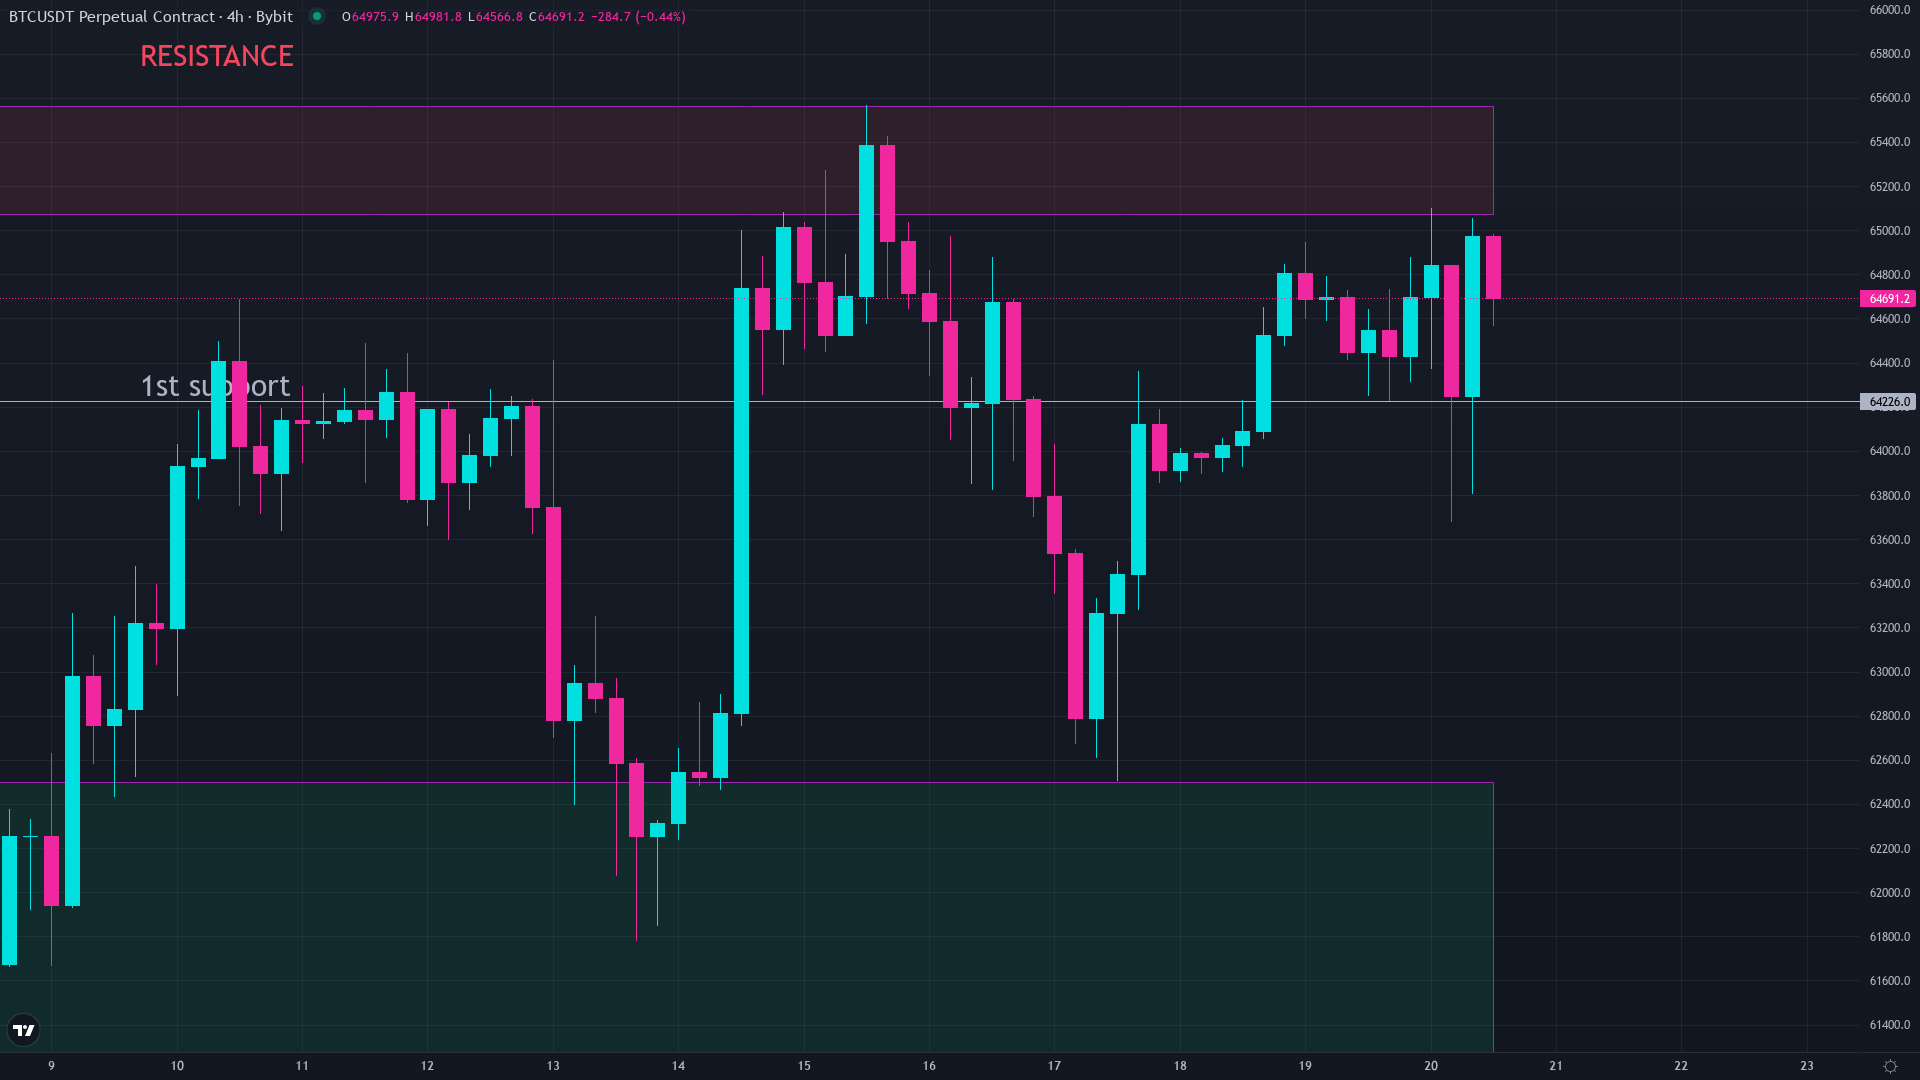
Now look at right now. The June 2026 PMI came in at 53.3. That is well above 50. Manufacturing is expanding. The economy is growing. If the “strong economy equals strong Bitcoin” theory held, Bitcoin should be doing well. Instead, Bitcoin is trading around $64,600 today, roughly 49% below the $126,200 peak it hit when the economy was supposedly in bad shape.
The theory fails in the exact same way in both directions. Bitcoin ran 8x while the economy shrank. Bitcoin fell 49% while the economy expanded. That is not a noisy link, it is no link at all.
Why does the idea spread if the data does not support it?
Because there is a grain of truth inside it, and people take that grain and build a house on it.
The small true thing is this: on a day when scary economic news hits, Bitcoin usually falls along with stocks. Risk-off days hit everything. If jobs data misses badly or a bank blows up, Bitcoin goes down. That is real and I am not going to pretend it is not. Bitcoin reacts to the daily mood of markets.
But reacting to a single scary day is not the same as being timed by the economy over months and years. Those are two completely different claims. People take the true, small thing (Bitcoin reacts to bad news days) and quietly upgrade it into the false, big thing (the economy drives Bitcoin’s multi-year cycles). They are not the same claim.
What does actually time Bitcoin’s cycle?
If the economy does not time the cycle, what does? The strongest pattern over four cycles is the halving, the event roughly every four years where the new supply of Bitcoin gets cut in half. The last three cycle tops landed 525, 546, and 534 days after their respective halvings, all within about a three-week window of each other. That is a tight cluster. A link that comes back near zero year over year does not produce a cluster that tight.
Three cycles is a small number, and no one should treat this as a guarantee. But three tops within three weeks of each other is a better pattern than a link that flips positive and negative almost every year. For more on what those patterns look like, the four-year cycle breaks it down from the start, and if you want to see whether the cycle is still on track, the business cycle vs halving comparison stress tests both ideas with the same data.
What to do with this
Stop watching the monthly PMI as a Bitcoin signal. It is noise. A number above 50 does not mean Bitcoin is going up, and a number below 50 does not mean Bitcoin is going down. Fifteen years of data say the link is basically zero and flips direction almost every other year.
The things that have mattered to Bitcoin’s multi-year moves are the supply schedule, the institutional flows, and the sentiment swings that come when everyone decides at the same time that crypto is either over or just getting started. The PMI does not move any of those levers in a reliable way.
The PMI was built to forecast recessions. It is a great tool used in the wrong place when people point it at Bitcoin.
Common questions
Does Bitcoin follow the economy?
Not reliably. When you measure how closely Bitcoin and the PMI move together over 15 years, the link comes back near zero and flips direction almost every year. Bitcoin ran 8x while the economy was contracting, then fell nearly 50% while the economy was expanding.
What is the PMI and why do people think it affects Bitcoin?
The PMI (Purchasing Managers’ Index) is a monthly gauge of factory activity. Above 50 means expanding, below 50 means contracting. People assume a strong economy boosts risk appetite and therefore Bitcoin, but the 15-year data does not support that link in any consistent way.
Did Bitcoin go up when the PMI was below 50?
Yes. Bitcoin’s biggest ever run, from about $16,000 to $126,200, happened mostly while the PMI was below 50 and the economy was technically contracting. The ‘strong economy equals strong Bitcoin’ theory fails on exactly this stretch of data.
Does a high PMI mean Bitcoin will rise?
No. The June 2026 PMI came in at 53.3, one of the stronger recent readings, yet Bitcoin is trading around $64,600, roughly 49% below its peak. A strong PMI reading has not translated into a rising Bitcoin price.
What actually drives Bitcoin’s multi-year cycles if not the economy?
The strongest repeating pattern across four cycles is the halving, the supply cut that happens roughly every four years. The last three cycle tops each landed within about a three-week window of each other, roughly 18 months after the halving. The economy has not produced a pattern that consistent.
Keep reading
We break down the market like this every day, free on Instagram and YouTube, and in depth inside the community.
Education, not financial advice. Trading involves real risk.