How To Spot A Real Bitcoin Bottom (The One Line That Has Never Been Wrong)
Every red week, someone on your feed calls the bottom for Bitcoin. Every green week, someone else does. After a while you stop knowing who to believe. So instead of listening to people, I look at one number that does not have an opinion.
The one line that has caught every bottom
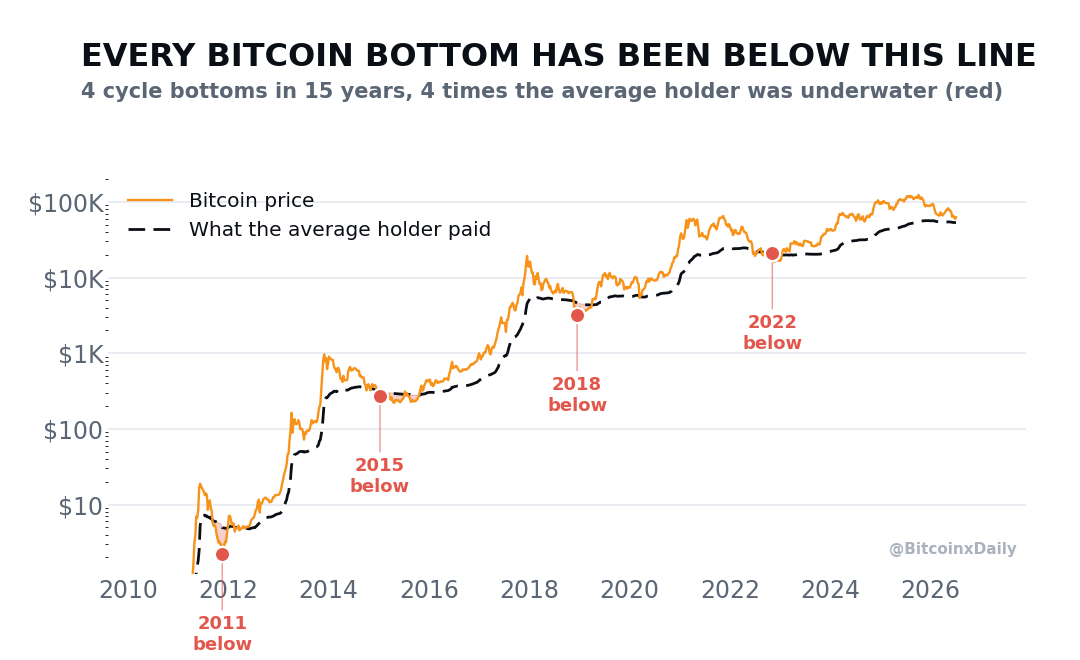
Take every Bitcoin in existence, look at the price each coin last moved at, and average them all together. That gives you one line. It is the whole market's break even, the average price everyone who owns Bitcoin actually paid. Analysts call it the realized price. I just call it the waterline.
Above the waterline, the average holder is sitting in profit. Below it, the average holder is underwater, holding at a loss. That simple line has marked the exact moment real bottoms form.
Fifteen years, four for four
Bitcoin has had four major bottoms in its history. They came in 2011, 2015, 2018 and 2022. Every single one printed below the waterline. Not one bottom formed while the average holder was still in profit. The selling did not stop while people were comfortable. It stopped after they were in real pain and the last sellers finally gave up.
Where we are right now
Today the waterline sits around 53,000 dollars. Bitcoin is trading around 63,000, roughly 18 percent above it. Even the recent low of about 57,700 dollars is still comfortably above the line. In plain terms, the average Bitcoin holder is still up money, and that has never been true at a real bottom.
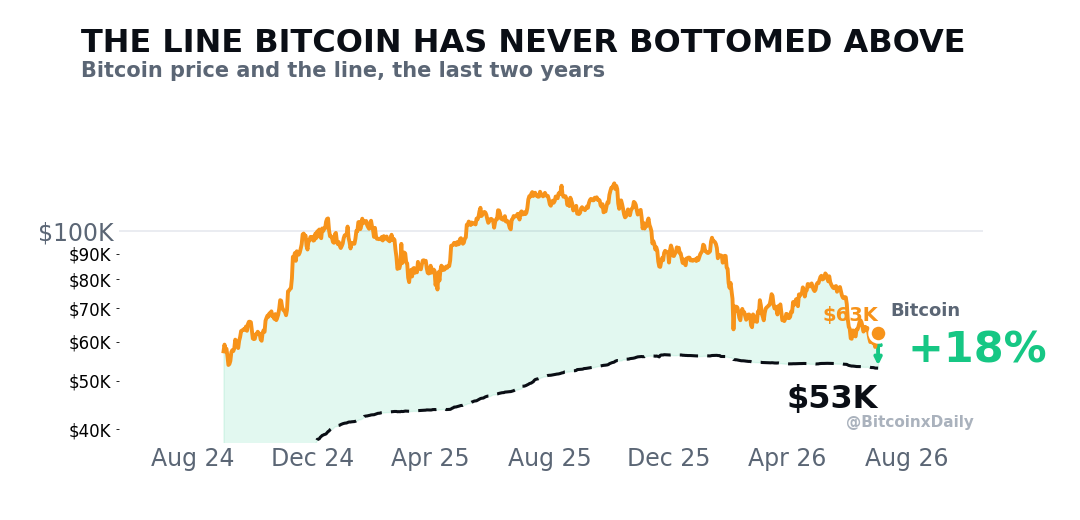
So when your feed says the bottom is already in at these prices, the waterline says not yet. For this to be the low, Bitcoin would have to break a 15 year, four for four record.
The honest part. It is a zone, not a day
This is where people get it wrong. The waterline marks an area, not an exact day. Once price drops below it, it can grind down there for months before the real low. In 2015, Bitcoin sat underwater for roughly half a year before it bottomed. And with only four completed cycles, this is a strong pattern, not a physical law. Treat it as a compass, not a stopwatch.
Where the pattern points for 2026
There is one more thing the data shows, and it is good news. The dip below the waterline is shrinking every cycle. In 2011, price fell 58 percent under the line. Then 44 percent in 2015, 31 percent in 2018, and just 25 percent in 2022. As Bitcoin matures, its crashes get shallower.
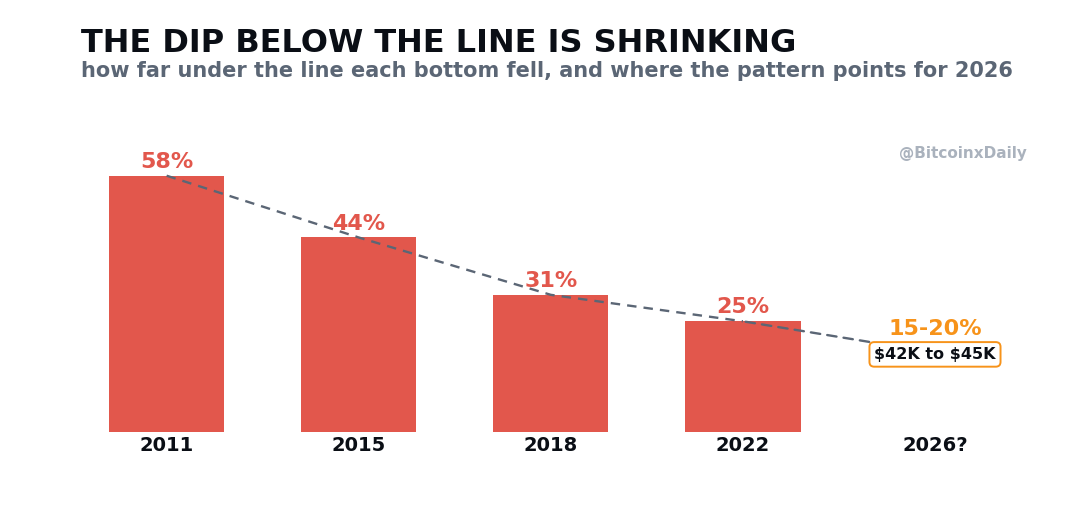
If that shrink holds, 2026 points to about 15 to 20 percent under the line. At today's waterline that is a bottom zone somewhere near 42,000 to 45,000 dollars. A shallow dip, not a 2018 style wipeout. It is a projection from a four point pattern, so hold it loosely, but it lines up with everything else. The bottom is probably not in yet, but it is likely close and likely shallow.
The takeaway
Stop trying to call the exact low to the dollar. Watch the waterline. The day the average holder finally gives up and price slips under that line is the day that actually matters. Until then, the people declaring victory above 60,000 are betting against a 15 year record, whether they know it or not.
I break down the market like this every day, free, on Instagram. To trade alongside me and the community, come to bitcoindaily.vip.
Educational, not financial advice. Every cycle is different and past performance is not a guarantee.
We break down the market like this every day, free on Instagram and YouTube, and in depth inside the community.
Education, not financial advice. Trading involves real risk.