Why Every Famous Bitcoin Top Indicator Failed at the Same Time
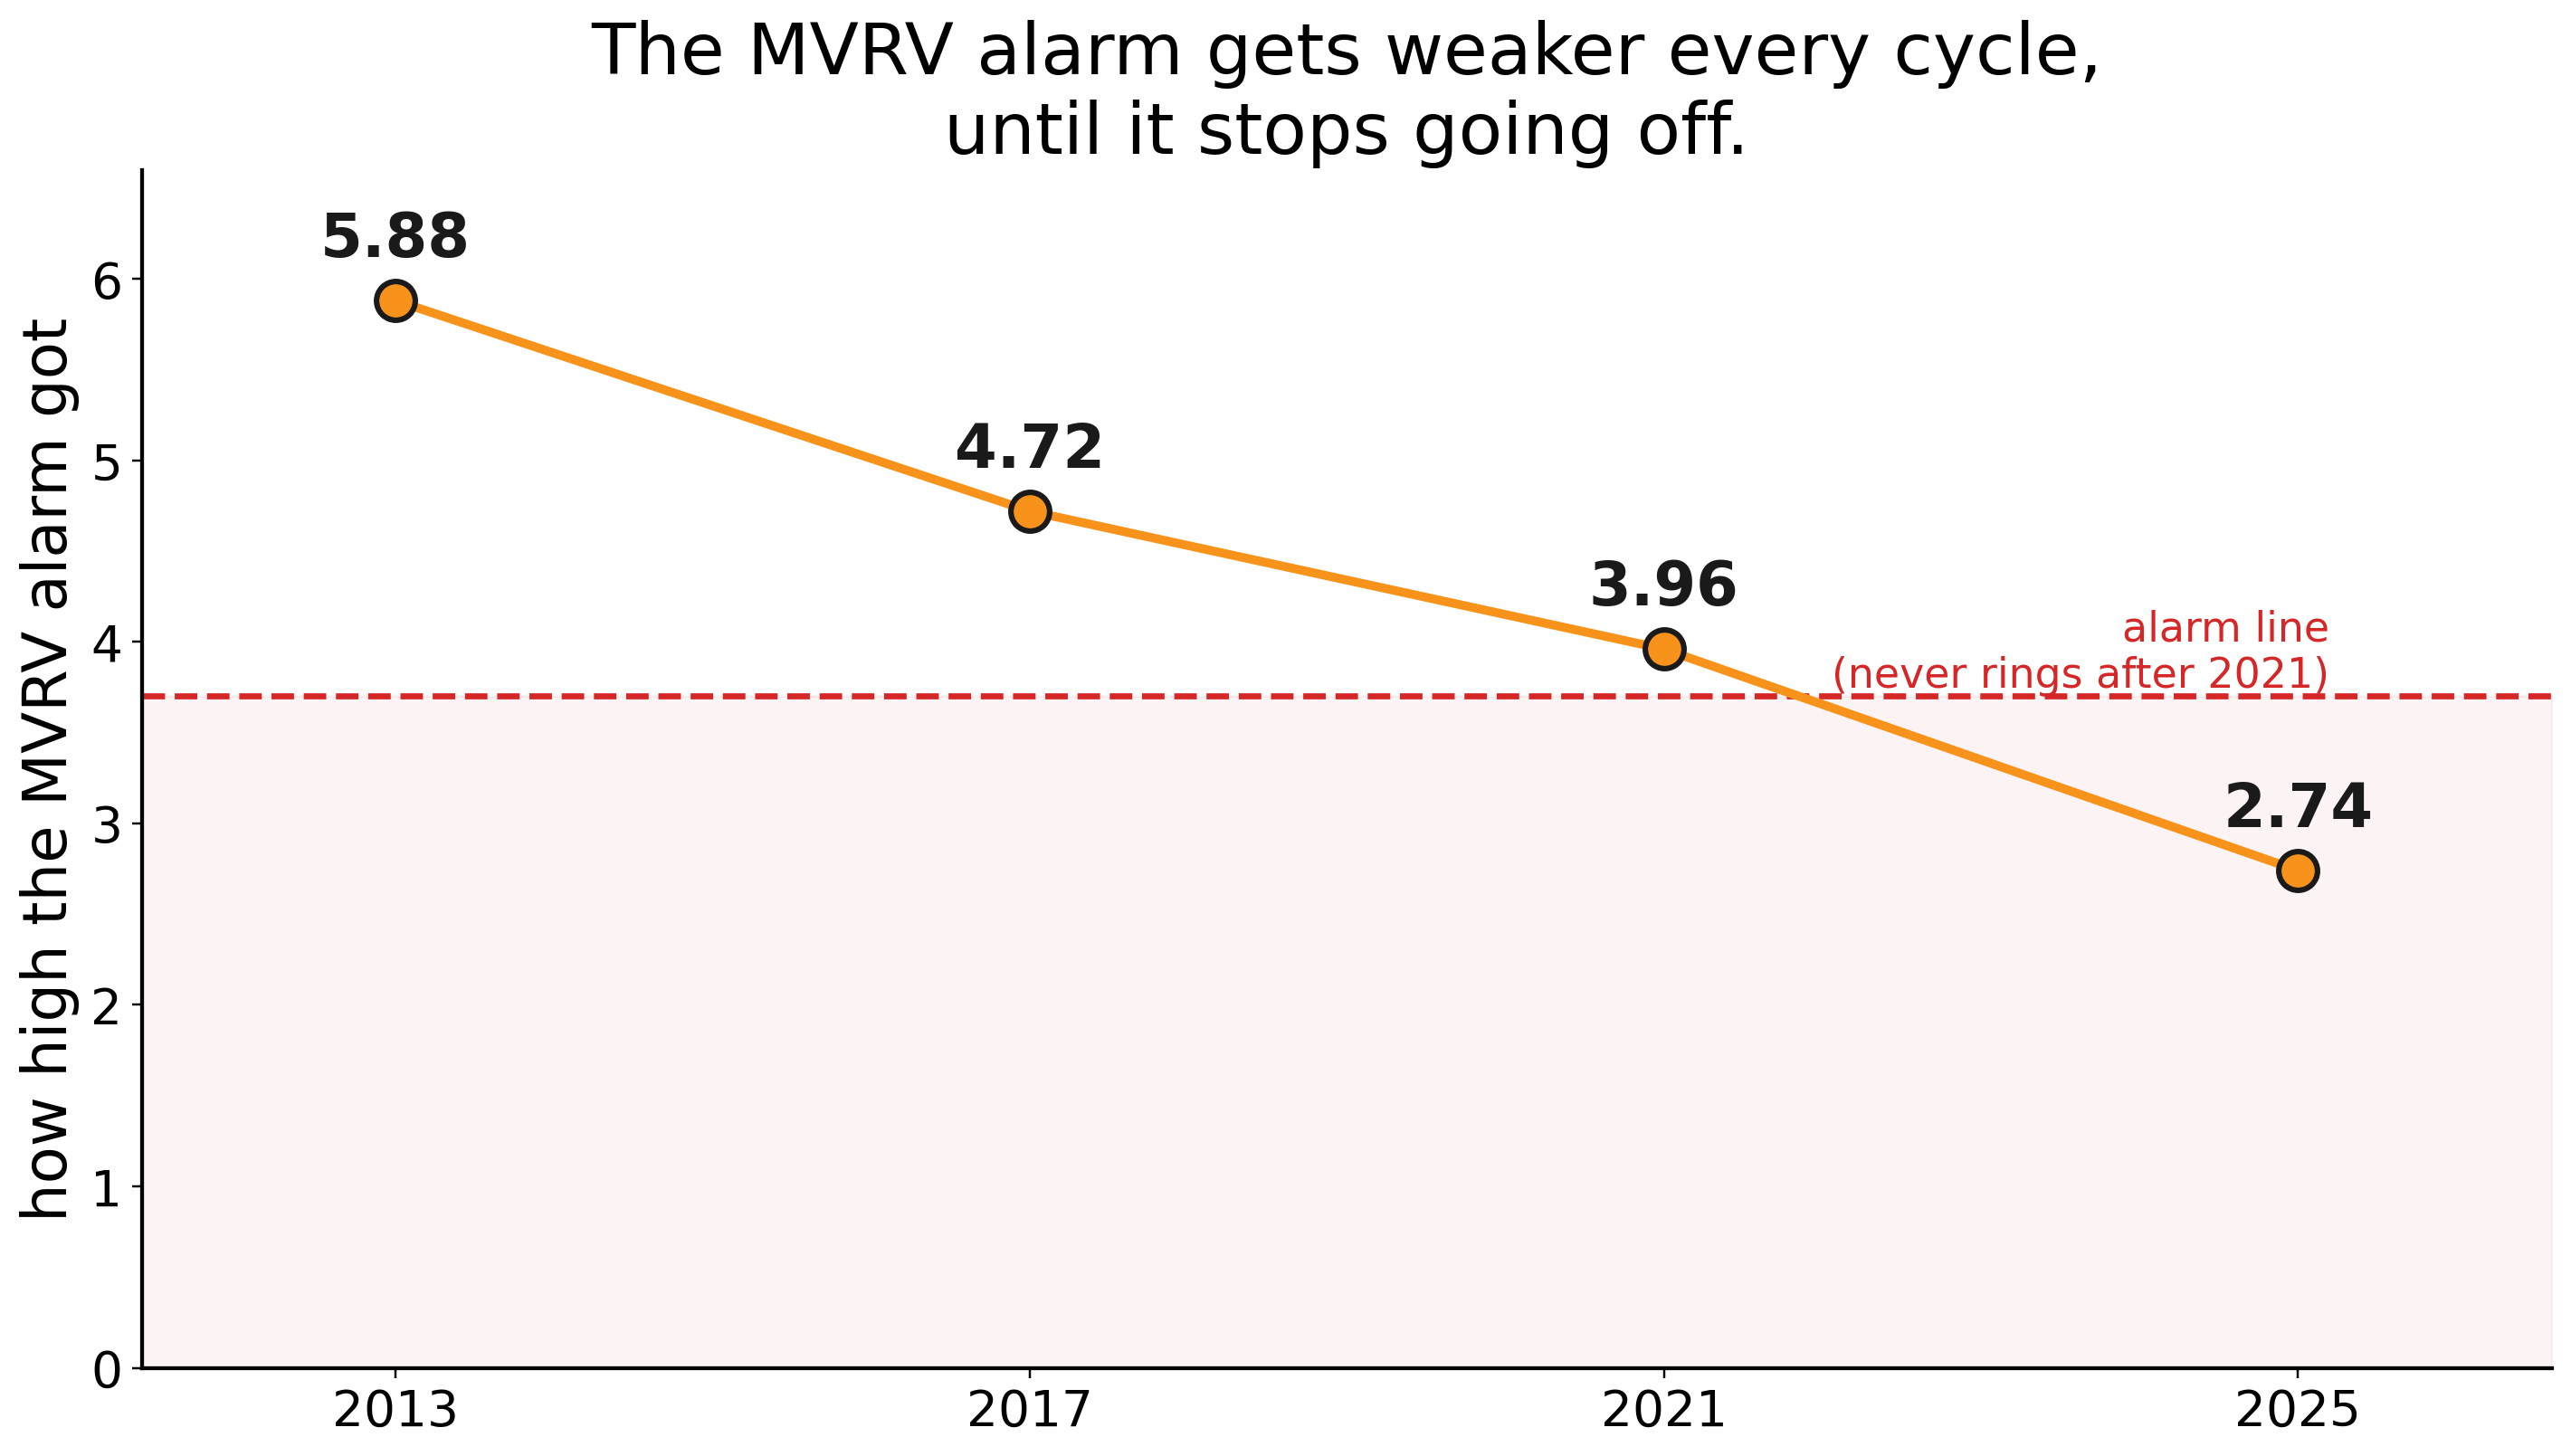
On October 6, 2025, Bitcoin printed the biggest top in its history, near $126,000. Every famous indicator built to call that exact moment stayed silent. Pi Cycle never crossed. MVRV never reached its danger zone. The Mayer Multiple was not even close.
For roughly a decade those tools flagged Bitcoin's cycle tops, sometimes within days. Then, at the largest top ever, all of them went quiet at the same time. Most post-mortems blamed bad luck or the ETFs. I am a data scientist, so I did the only thing that settles an argument like this. I ran the full history.
What I found became a research paper, "Bitcoin Runs on a Clock," now live on SSRN. The short version is that the silence was structural. The indicators did not break in 2025. They were always going to break.
The alarm bolted to the wall
Picture a flood alarm bolted to a wall at a fixed height. It works perfectly for years because the water always rises past it. Then the floods start getting smaller. The water still rises, but it stops reaching the sensor. The alarm goes silent. Not because the flood stopped happening, but because the alarm was built for bigger waves.
That is what happened to Bitcoin's top indicators. Every one of them is a line drawn at a fixed height, and Bitcoin's price swings shrink every cycle.
Line the peaks up and it is impossible to miss. MVRV, which compares Bitcoin's price to the average price everyone paid for their coins, peaked at 5.88, then 4.72, then 3.96, then just 2.74 across the last four cycles. The Mayer Multiple went from 8.26 to 1.52. The waves got smaller every single cycle. The trigger lines never moved.
The popular excuse is that ETF custody distorted the on-chain data. But this decay started three cycles before a Bitcoin ETF existed. The signals never missed before because the wave was always big enough to touch the line. That was never skill.
The one thing that did not decay
Here is where it gets interesting. The size of each cycle keeps shrinking. The timing does not.
Bitcoin's cycle tops keep landing 525 to 546 days after each halving, the supply cut written into Bitcoin's code. Four cycles, one narrow window.
To make sure that was not a fluke, the study runs a brutal test. Simulate 10,000 random markets and look for timing that clusters that tightly. Under the primary test, zero of the 10,000 produced it. Even the most conservative version put the odds near 1 in 1,000.
So the loudest debate in crypto right now, whether the four-year cycle is dead, has an answer where both sides are half right. The amplitude is dying. The clock is not.
Two dated calls, on the record
A model that only explains the past is a bedtime story. So the paper makes two dated predictions.
First, a cycle bottom between October 5 and November 16, 2026. Those are committed dates, not a vibe. If the bottom lands before October 5, the model takes the loss in public.
Second, the next cycle top 525 to 546 days after the next halving, which currently points to late 2029.
Plenty of analysts are calling an October bottom right now. The difference is that this window comes from the same halving arithmetic that called the October 2025 top in advance, and it ships with public code anyone can rerun.
My receipt includes a miss
On January 11, 2025, nearly nine months ahead of time, I posted a video telling my audience Bitcoin would top in October 2025. It topped on October 6.
That same cycle, I also called a top price of $150,000 to $200,000. The actual high was near $126,000. Right on when, wrong on how much.
I am not hiding that miss. It is the entire thesis of the paper playing out in public. The timing held. The size came up short, exactly the way a shrinking market says it should.
Check my work
Everything in the study is built to be checked. The trend fit only uses data that was available at each point in time, so there is no hindsight baked in. Statistics that failed a shuffle test were thrown out instead of reported. The pattern repeats on a second data source and on a second asset, Ethereum. The code is public, so anyone can rerun it and get the identical numbers.
The full paper is on SSRN, and the plain-English walkthrough lives at bitcoin-daily.com/research. Read it, then try to break it. That is the whole point of putting dates on the record.
Common questions
Why did Bitcoin's top indicators fail at the October 2025 top?
Because they are fixed trigger lines and Bitcoin's swings shrink every cycle. MVRV's peak fell from 5.88 to 4.72 to 3.96 to 2.74 across the last four cycles, and the Mayer Multiple's peak fell from 8.26 to 1.52, so the market stopped reaching the lines. The decay began three cycles before a Bitcoin ETF existed, so ETFs are not the explanation.
What is the Bitcoin halving clock?
It is the finding that Bitcoin's cycle tops keep landing 525 to 546 days after each halving. In 10,000 simulated random markets, none clustered that tightly under the study's primary test, and even the most conservative variant put the odds near 1 in 1,000.
When does the study call the Bitcoin cycle bottom?
The paper puts a cycle bottom window between October 5 and November 16, 2026 on the record. If the bottom lands before October 5, the model takes the loss in public.
Where can I read the research?
The full study, Bitcoin Runs on a Clock, is on SSRN at https://papers.ssrn.com/sol3/papers.cfm?abstract_id=6977940, and a plain-English walkthrough is at https://bitcoin-daily.com/research.
Keep reading
- Bitcoin Runs on a Clock. The Research Paper
- Is the Bitcoin 4-Year Cycle Dead? I Tested It
- The Pi Cycle Top Indicator, Explained
We break down the market like this every day, free on Instagram and YouTube, and in depth inside the community.
Education, not financial advice. Trading involves real risk.