How Deep Do Bitcoin Bear Markets Go?
Every Bitcoin crash has looked like the end. Every single one. People declared Bitcoin dead. They wrote the eulogies. They moved on. And every time, no matter how brutal the fall felt going through it, the story ended the same way.
The question is not whether Bitcoin crashes. It does, and it always has. The real question is how deep Bitcoin bear markets actually go, and whether there is any pattern worth knowing. There is. And once you see it, you cannot unsee it.
How deep each Bitcoin crash has actually gone
Here is the full history of Bitcoin’s major bear markets, measured by how far the price fell from the top:
- 2011: Bitcoin fell 93% from its peak. From $32 down to around $2. Most people who owned it during that crash sold and never came back.
- 2013 to 2015: Bitcoin fell 86%. From $1,163 down to about $150. This one took nearly two years to fully bottom out, grinding lower long after most people had given up watching.
- 2017 to 2018: Bitcoin fell 84%. From just under $20,000 down to $3,100. The headlines called it dead every week for over a year.
- 2021 to 2022: Bitcoin fell 77%. From $69,000 all the way down to $15,400. Still one of the most painful stretches in the asset’s history, but a smaller percentage fall than every single cycle before it.
You can see all four of these cycles laid out side by side, each one aligned from its own peak, on the live Bitcoin crash depth chart.
The pattern in Bitcoin’s crash history
Take those four numbers in order. 93%. 86%. 84%. 77%. The crashes are getting shallower. Not dramatically, and not all at once, but consistently, every single major cycle.
That is what tends to happen when a new asset matures. More buyers entering the market. Bigger institutions holding larger positions and not panicking at the first sign of pain. More people who have lived through a crash before and know what the bottom of one looks like. The floors have been rising, even as the falls keep hurting.
This does not make the crashes painless. 77% still means someone who bought the top in 2021 watched their $10,000 turn into $2,300 before anything got better. But the people who held through that did not get wiped out the way someone who held through an 86% crash in 2015 did. Each cycle, a bit less catastrophic.
Where does the current bear market stand?
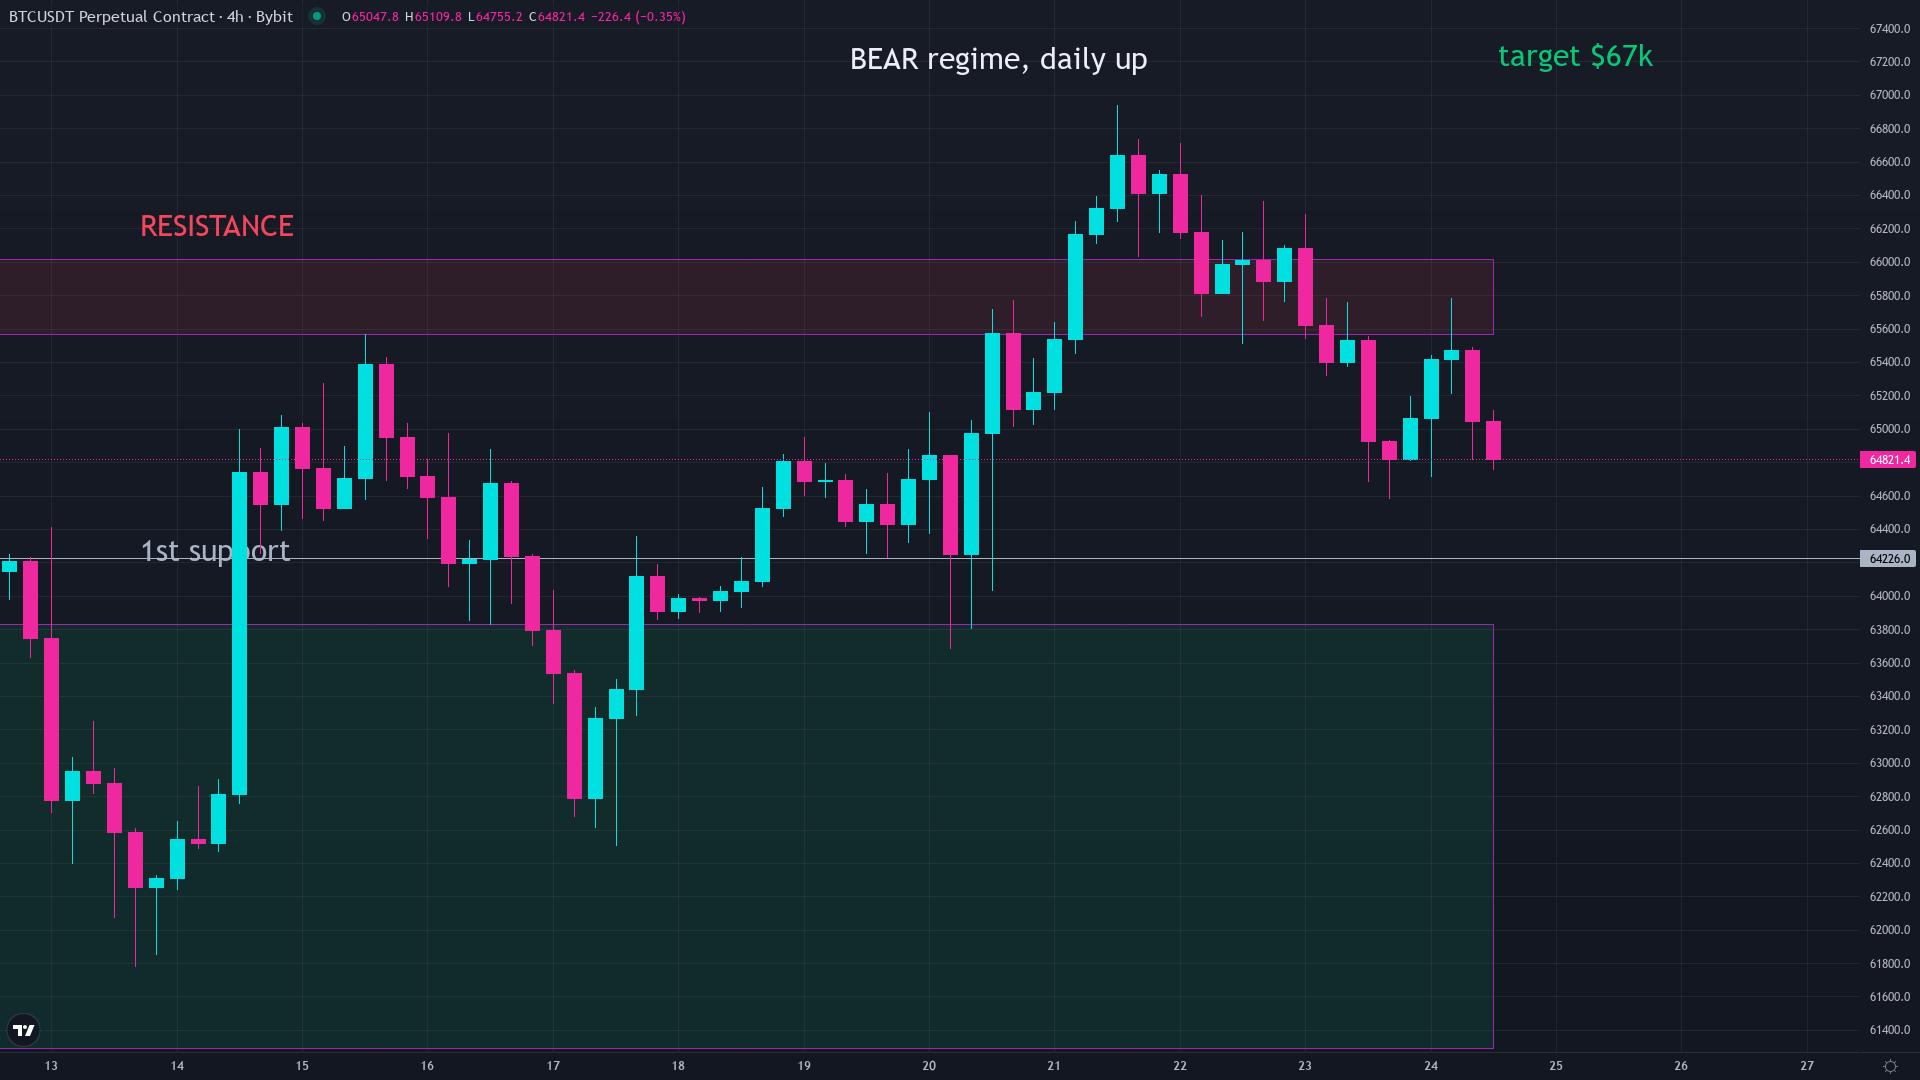
Bitcoin set its all-time high near $109,000 in early 2025. As of today, Bitcoin trades around $64,300. That is roughly 41% below the all-time high.
If the shrinking pattern holds, this cycle should bottom at a less severe point than the 77% fall we saw in 2022. So far, the numbers point that way. But no one rings a bell at the bottom, and historical patterns are guides, not guarantees. The bear may still have further to run.
What the full crash history does tell you is something simpler. In every past cycle, the people who sold at 40% down sold long before the recovery came. Not because the pain stopped at 40%, but because they stopped being in the game by the time it did.
The Fear & Greed Index reads 28 right now, in Fear territory. Historically, readings in that zone have clustered near the later stages of bear markets, not the early ones. For what that reading actually means, the full fear and greed index breakdown shows exactly where those numbers have appeared before.
What has marked Bitcoin’s past bottoms
No single number has called every Bitcoin bottom perfectly. What the data shows instead is a cluster of things that have appeared together near the lows every time. The average price paid by all Bitcoin holders rising above the current price, meaning the market as a whole is sitting at a loss. Sentiment deep in Fear or Extreme Fear. Long stretches of time without a new high. None of these fire on the exact day of the low. But they have all shown up within range of it, in every past cycle.
If you want to go deeper on what those specific signals look like and where they sit right now, the guide to spotting a real Bitcoin bottom walks through each one. The crash depth chart alongside it shows you visually how far this cycle has gone compared to every one before it.
The honest takeaway
Bitcoin has had four major bear markets. Each one looked like the end. Each one ended. The falls went 93%, 86%, 84%, 77%. The trend has been shallower crashes, not deeper ones. The current one, measured so far, fits that same pattern.
That does not mean it is over. It means that if you are new to this and the current fall feels uniquely bad, you are reading from the same script that every generation of Bitcoin holders has read from. The crash always feels like this. The history says it has always felt exactly like this, and then it stopped.
Common questions
How much has Bitcoin fallen in a typical bear market?
The four major Bitcoin bear markets have seen prices fall between 77% and 93% from the peak. The most recent one, in 2022, was the shallowest at 77%, and each cycle has been less severe than the one before it.
Has Bitcoin always recovered after a big crash?
Every major Bitcoin crash in history has eventually been followed by a new all-time high. That is a track record of four out of four, though past results do not guarantee a fifth.
When does Bitcoin stop falling in a bear market?
No single signal calls the exact bottom, but a cluster of things has appeared near every past low: extreme fear in sentiment readings, and the average price paid by all Bitcoin holders rising above the current market price.
How long does a Bitcoin bear market usually last?
The four major Bitcoin bear markets lasted between roughly 12 and 26 months from peak to bottom. For the full breakdown by cycle, the article on Bitcoin bear market durations covers each one in detail.
Is the current Bitcoin crash the worst ever?
No. As of mid-2026, Bitcoin is roughly 41% below its all-time high near $109,000. Prior cycles saw falls of 77% to 93%, making the current one the shallowest major bear market in Bitcoin's history so far.
Keep reading
- How Long Do Bitcoin Bear Markets Last?
- How To Spot A Real Bitcoin Bottom (The One Line That Has Never Been Wrong)
We break down the market like this every day, free on Instagram and YouTube, and in depth inside the community.
Education, not financial advice. Trading involves real risk.