Indicators Explained
The numbers everyone quotes but few understand. Plain-English breakdowns of the Fear and Greed Index, funding rates, and liquidations, what each one measures and what it does (and does not) tell you about price.
Bitcoin's 4-Hour RSI Just Hit 94.4. Here Is What Happened Every Other Time.
Bitcoin's 4-hour RSI hit 94.4 this week, a level exceeded only once in 13 years of data. I scored every overbought reading since 2012 by the kind of market it fired in. In bull years the median outcome three months later was up 18%. In bear years, all 8 cases were lower. Here is the full split, the timing after each cycle top, and the line that would change the read.
What Happened to the Stock-to-Flow Model?
Stock-to-flow matched ten years of Bitcoin's price almost perfectly, and then it stopped working. The model pointed at roughly $714,000 for this cycle and Bitcoin topped at $126,272, a miss of 5.7 times. The interesting part is not that it broke. It is that everything you needed to predict the break was available in 2019.
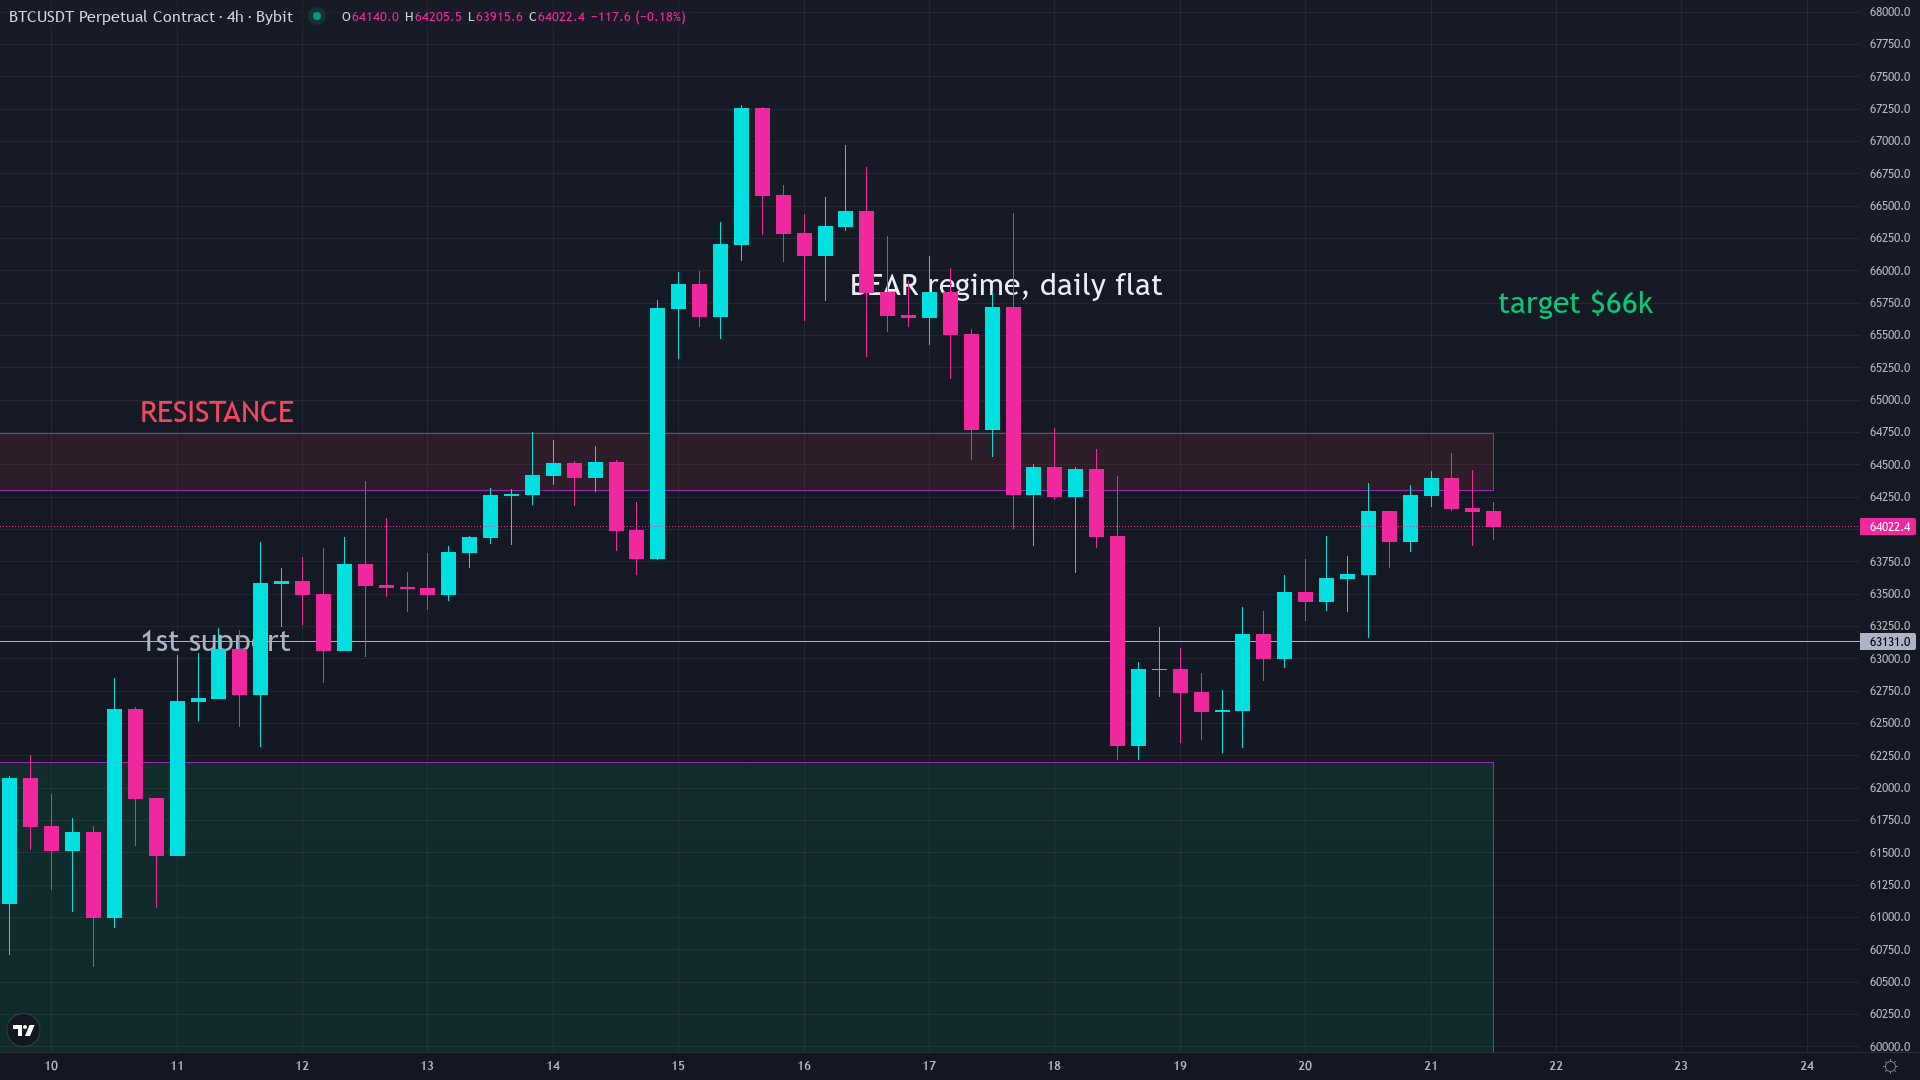
Bitcoin Fear and Greed Index Explained
The Fear and Greed Index just hit Extreme Fear. Here is what that number actually measures, what it got right and wrong in the past, and why it is not a buy signal by itself.
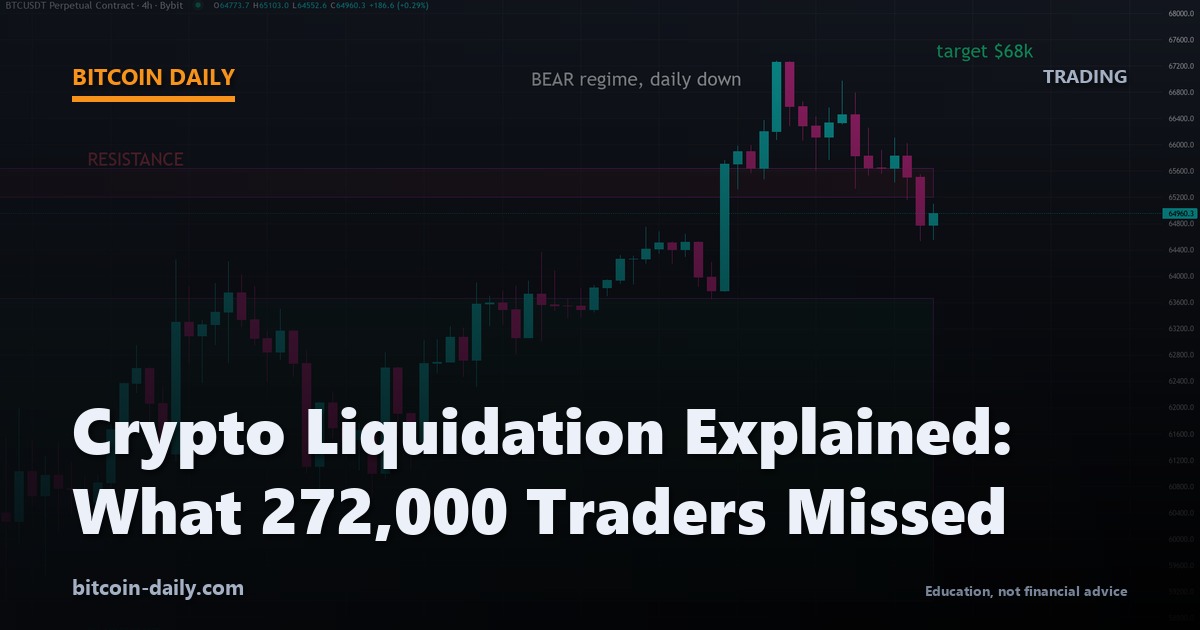
Crypto Liquidation Explained: What 272,000 Traders Missed
Liquidation is not bad luck. It is a math problem with a known solution, and 272,000 traders ran into it the hard way.
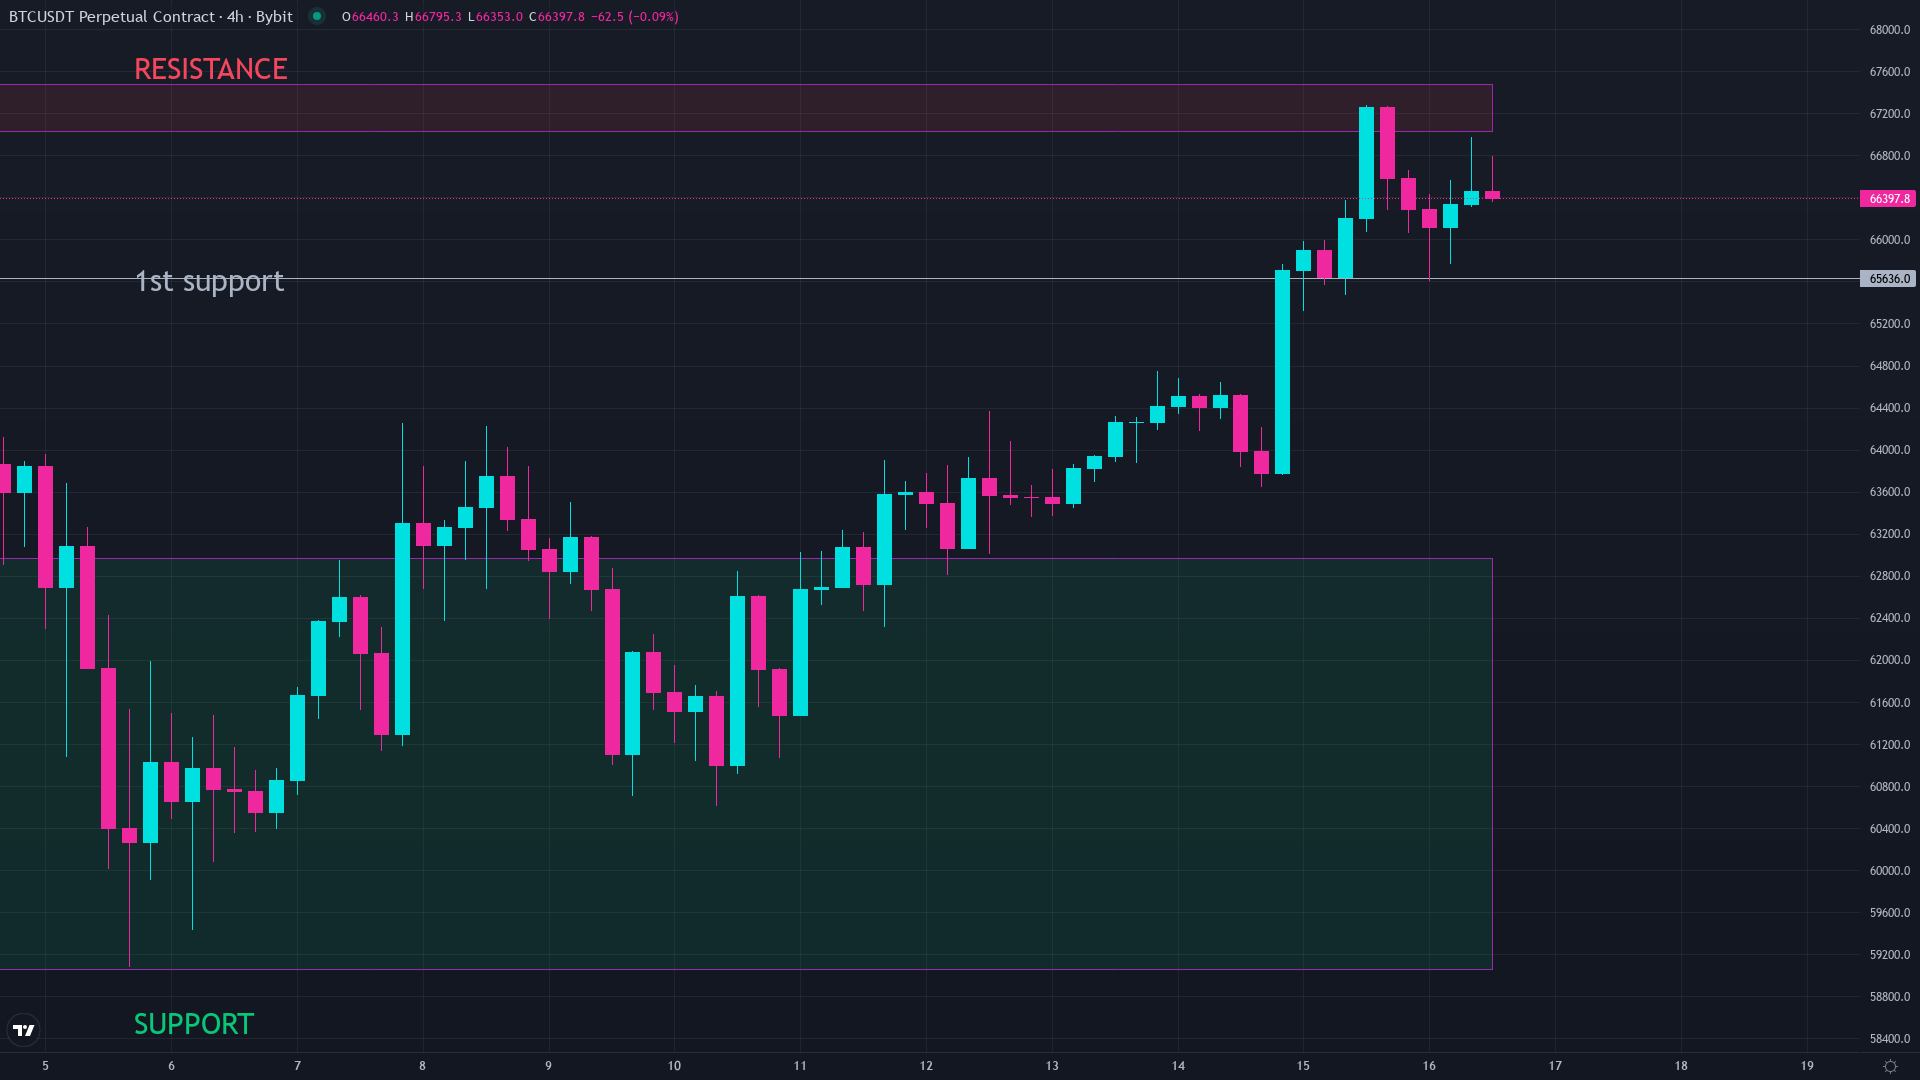
Bitcoin Funding Rate Explained: The Signal Most Traders Miss
The number most traders ignore tells you which side of the market is scared enough to pay to stay in the trade.