Cycles & Timing
Bitcoin moves on a clock. These posts break down the four-year cycle, what the halving actually does to price, how the seasons play out, and what every prior bear market says about where we are now.
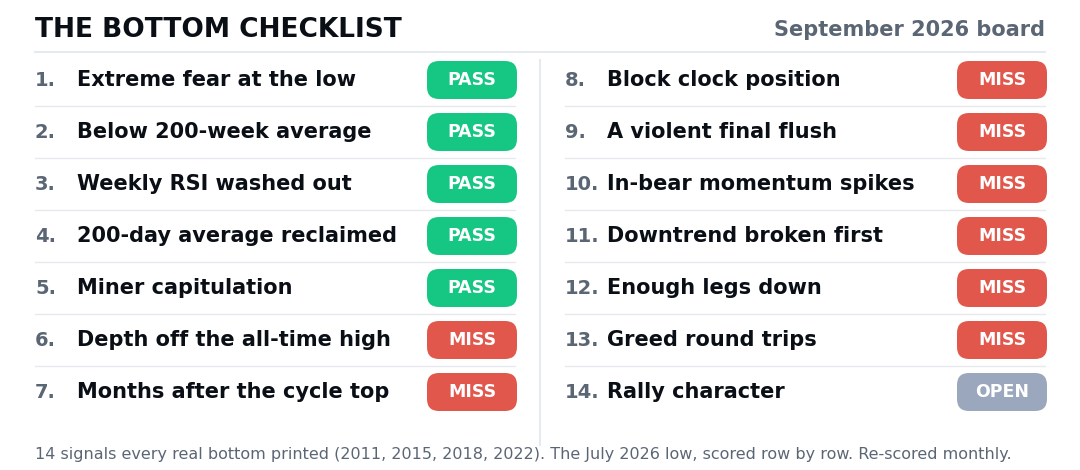
The Bitcoin Bottom Checklist, September 2026: 14 Signals, Scored in Public
The monthly Bottom Scorecard, September edition. 14 signals every real Bitcoin bottom printed, tested against 2011, 2015, 2018 and 2022, scored against the July low row by row. August moved three rows, the board reads 5 green, 8 red, 1 pending, and both the calendar clock and the block clock open the historical bottom window within weeks.
The 4-Year Cycle Is Measured Wrong
Everyone has a theory about the four-year cycle. Almost all of them measure it in the wrong unit. The halving is defined as 210,000 blocks, the chain does not run on schedule, and re-scoring the cycle in its native coordinate tightens the tops, partly rescues the bottoms, and dissolves an argument that ran for years.
What Is Bitcoin's Worst Month? The Data Says August
Ranked by their typical year, September comes in at -2.4% and August at -8.6%. August is the worst month on Bitcoin's calendar, it has been green only 5 times in 16 years, and in every bear market it has finished red.
Is Summer Bad for Bitcoin? 14 Years of Data
Averaging all 14 Bitcoin summers gives you +13%, which is why most seasonality charts are useless. Split them by whether Bitcoin started June above or below its long-run trend and two completely different markets fall out.
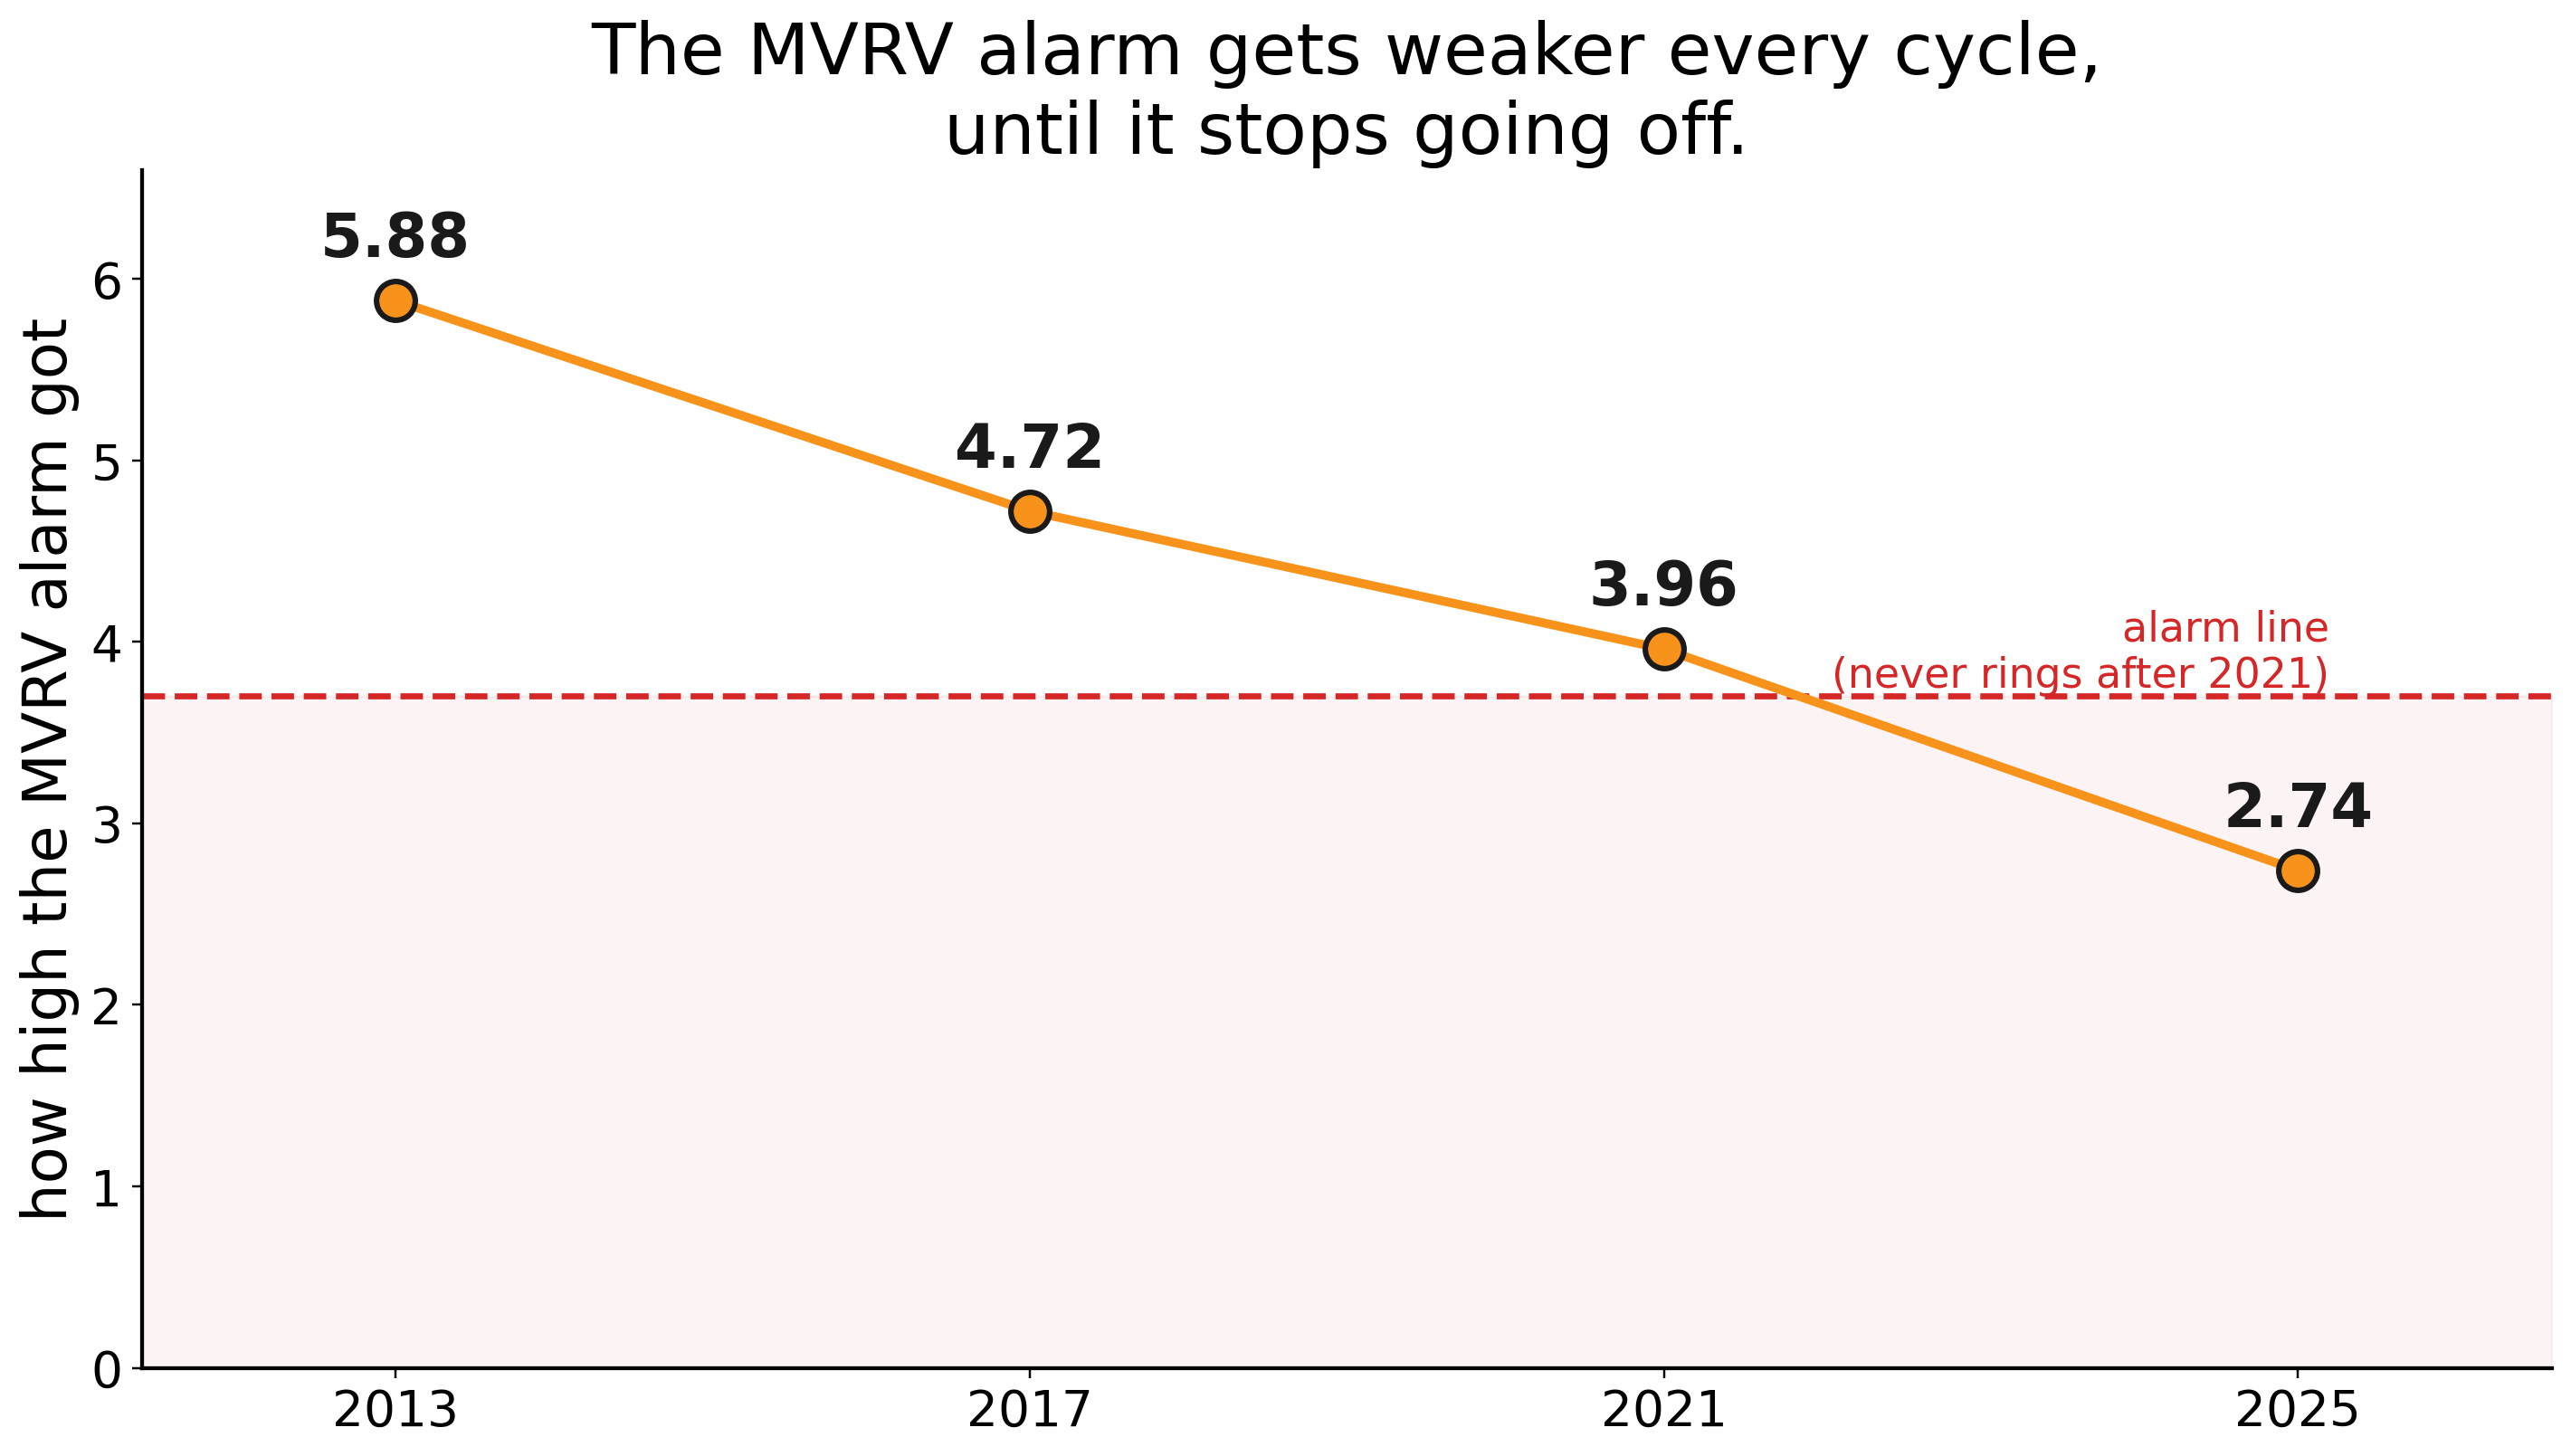
Why Every Famous Bitcoin Top Indicator Failed at the Same Time
At the biggest top in Bitcoin's history, every famous top indicator stayed silent. I ran the full history to find out why, and what I found became a research paper.
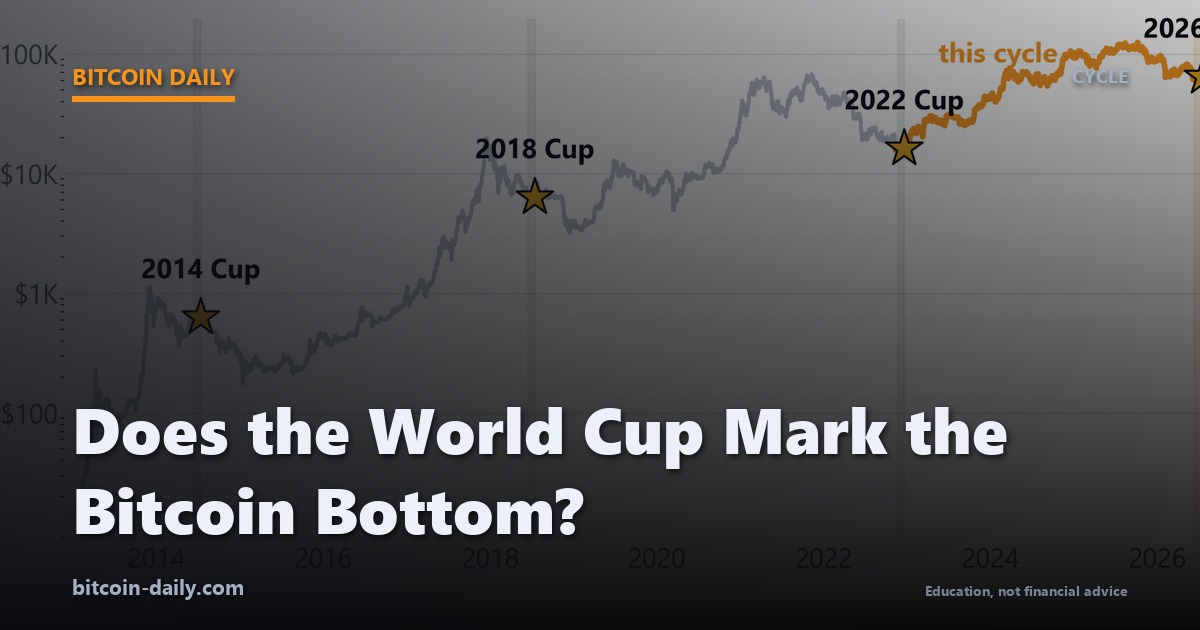
Does the World Cup Mark the Bitcoin Bottom?
A viral chart says the World Cup marks the Bitcoin bottom. I lined up all four World Cups against the price, and the real record is 1 for 3.
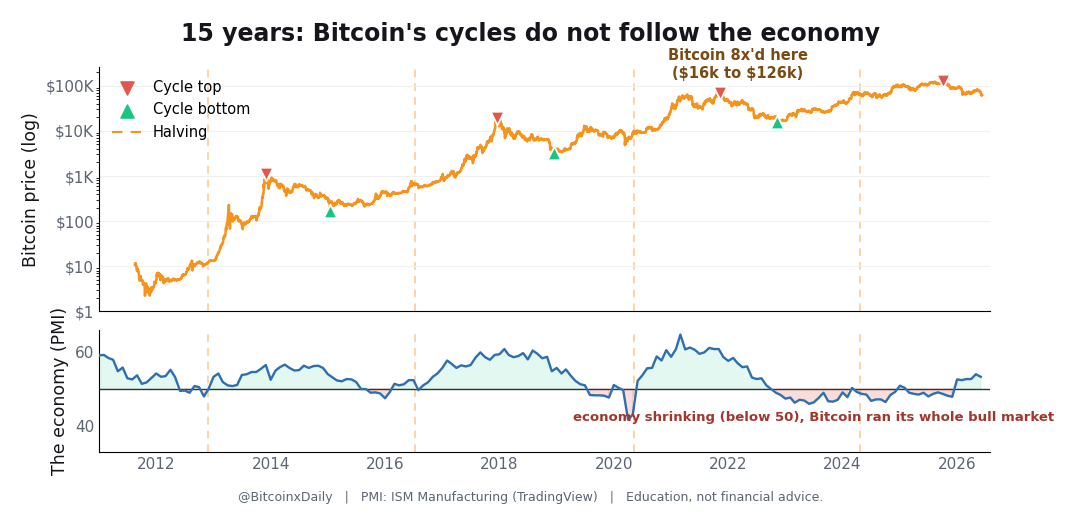
Does Bitcoin Follow the Business Cycle? 15 Years, Tested
The most repeated idea in crypto right now is that the economy runs Bitcoin, not the halving. I tested it on 15 years of data. The economy loses.
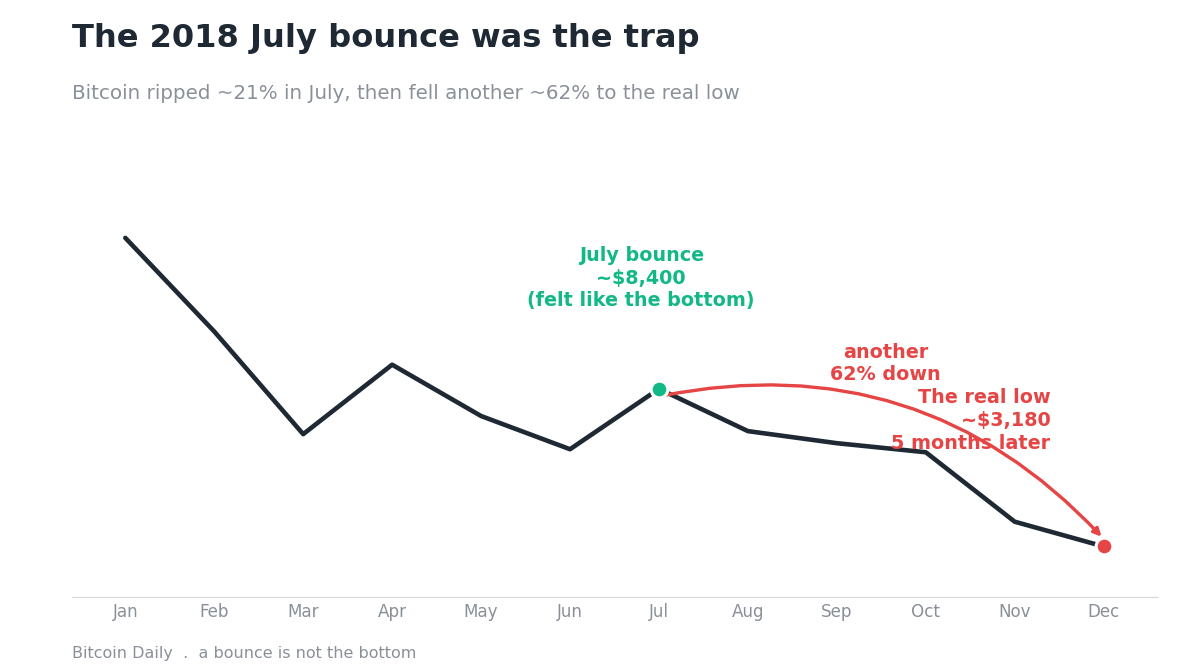
Is the Bitcoin Bottom In? Why July 2026 Is a Trap
A green July is very likely. In a bear market, the July bounce has never been the real bottom. Both are true at once, and the gap between them is the trap.
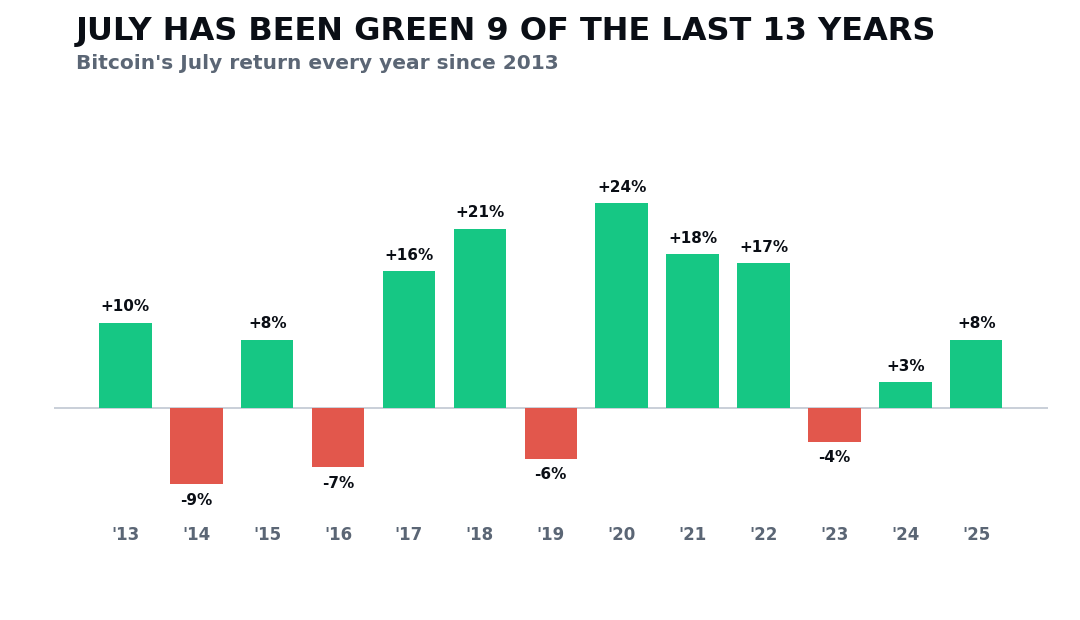
Bitcoin July Seasonality: Does July Bounce?
Bitcoin tends to bounce in July, and in bear-bottom years it has been green 3 for 3. Here is the real record, and the honest caveat the pump crowd skips.
Is the Bitcoin 4-Year Cycle Dead? I Tested It
I spent two weeks trying to prove the Bitcoin 4-year cycle is fake. Test one killed the calendar version. Then 10,000 fake Bitcoins showed me what was actually real.

How Low Will Bitcoin Go? What Every Crash Says
Bitcoin is down 53% from its peak and the Fear and Greed Index just hit 13. Every prior crash looked like this, and every one ended the same way.
Bitcoin Four Year Cycle Explained
Bitcoin has topped, crashed, and bottomed on roughly the same four-year schedule since 2011. Here is the full history, why it happens, and where this cycle stands today.
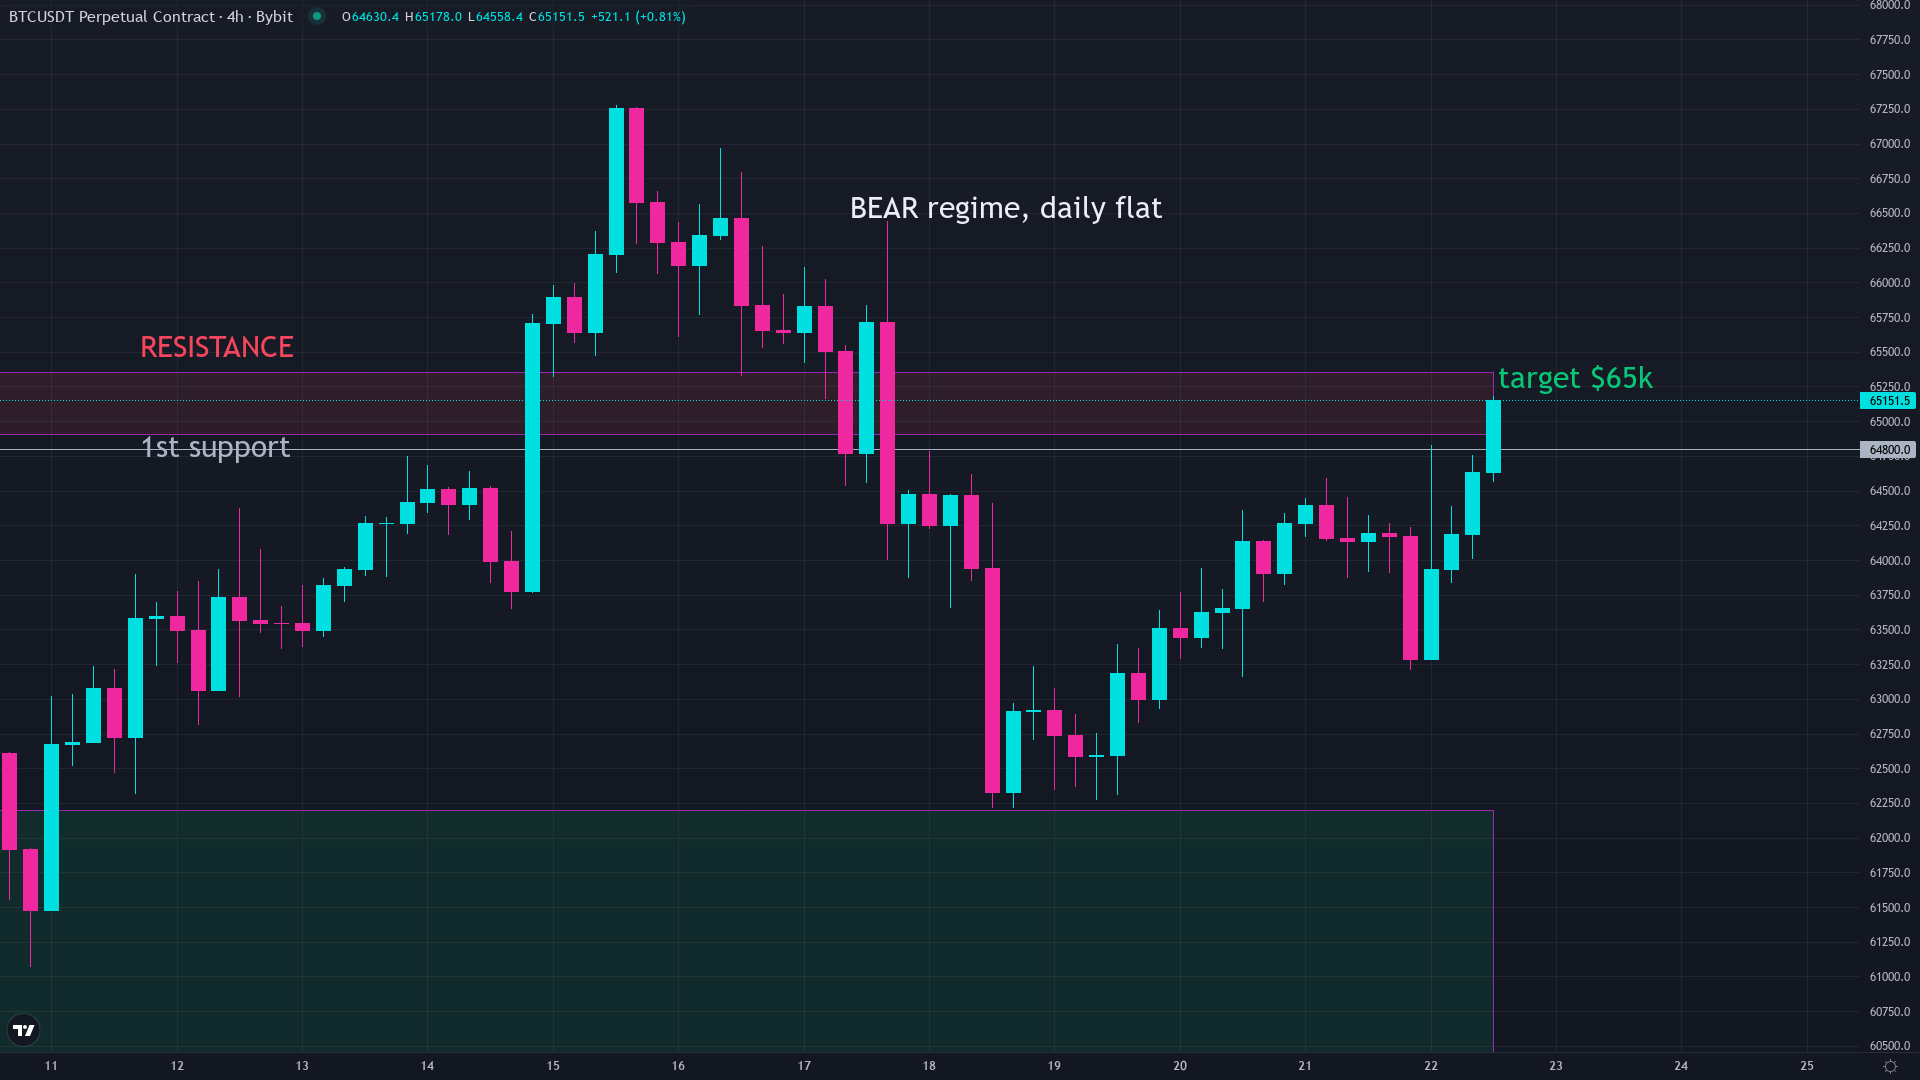
Bitcoin Halving Explained: Why It Moves the Price
Every four years, Bitcoin cuts new supply in half. Here is what that means, what happened after every halving in history, and why it matters right now.
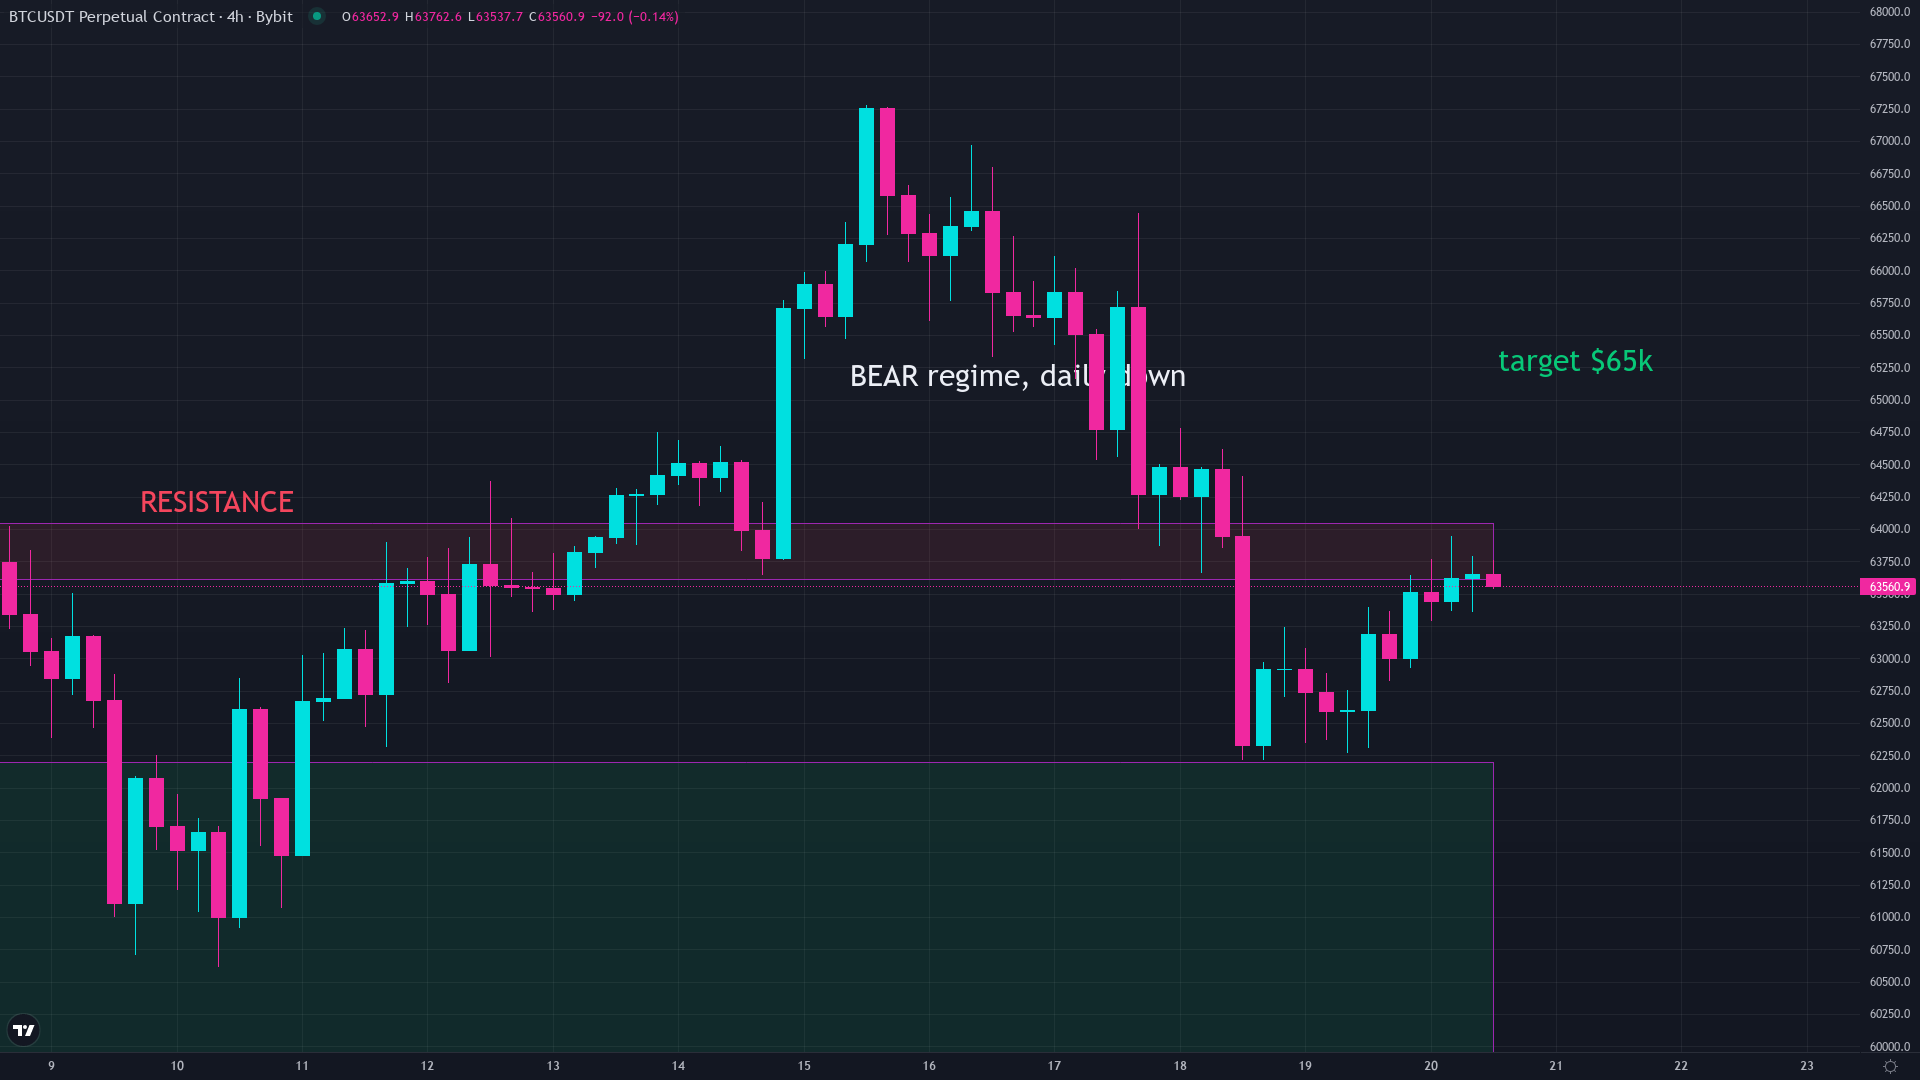
How Long Do Bitcoin Bear Markets Last?
Every Bitcoin bear market has followed the same rough script: a brutal crash, a slow grind, then a bottom nobody believes. Here is the full history, and what it says about this one.
Why Bitcoin Bleeds in the Summer (in a Bear Market)
In a bull market Bitcoin's summer averages +28%. In a bear it averages -14%. Here is why, and what the data says happens after.